Free Access
Fig. 7
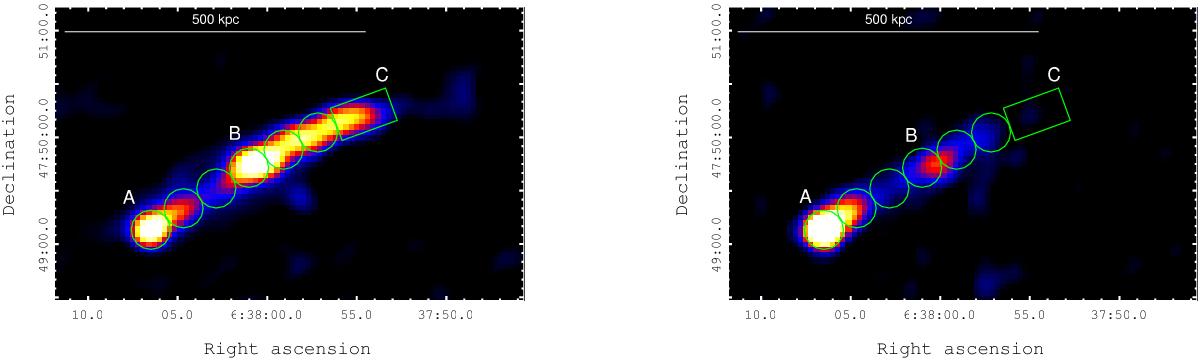
GMRT 320 MHz (left) and JVLA B+D array 1.5 GHz (right) colour images. Both are convolved with a 15′′ × 15′′ beam. The green regions mark the areas where we calculated the spectral index to trace its evolution along the tail.
Current usage metrics show cumulative count of Article Views (full-text article views including HTML views, PDF and ePub downloads, according to the available data) and Abstracts Views on Vision4Press platform.
Data correspond to usage on the plateform after 2015. The current usage metrics is available 48-96 hours after online publication and is updated daily on week days.
Initial download of the metrics may take a while.