Fig. 12
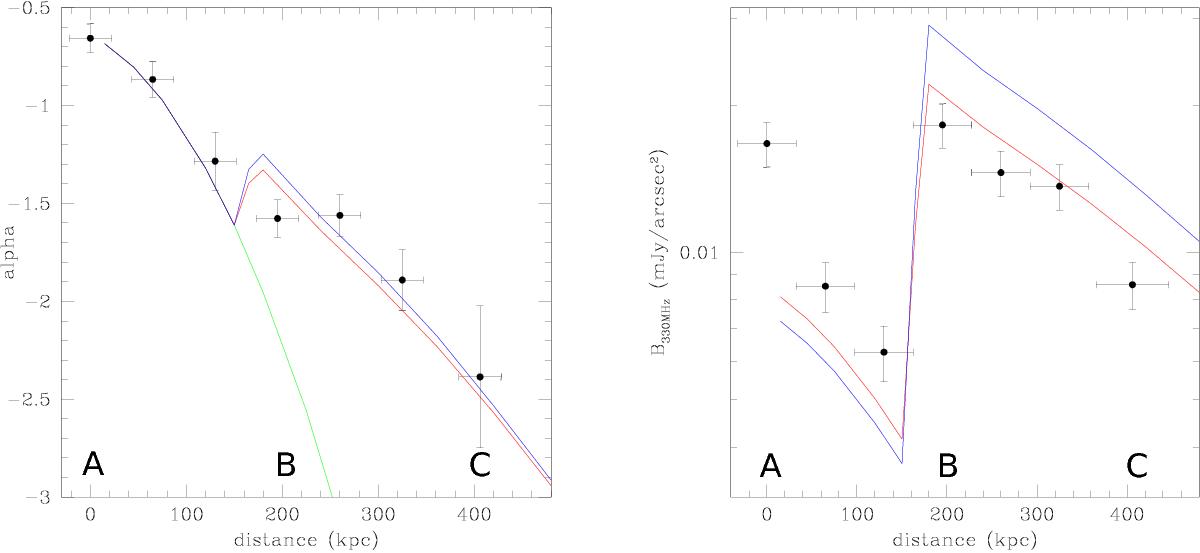
Left: spectral index of the HT vs. distance from the “head”. The green line is the classical model of synchrotron ageing of a population of electrons that have been accelerated in the “head”. The injection spectrum is assumed to match the spectrum in the head of the tail. Right: radio surface brightness vs. distance; model normalisation (Ke in Appendix) is chosen to best illustrate the comparison with the data. A, B and C refer to Fig. 8. In both panels the model parameters are: ℳ = 1.7, θSO = π/ 2, a = 1, cS = 1330 km s-1, σv = 1400 km s-1, ψ(t = 0) = 1, ηsinθO = 1, with θO = 60° and θSO = 90°, Γ = 5/3 (red line) and Γ = 4/3 (blue line).
Current usage metrics show cumulative count of Article Views (full-text article views including HTML views, PDF and ePub downloads, according to the available data) and Abstracts Views on Vision4Press platform.
Data correspond to usage on the plateform after 2015. The current usage metrics is available 48-96 hours after online publication and is updated daily on week days.
Initial download of the metrics may take a while.