Free Access
Fig. 11
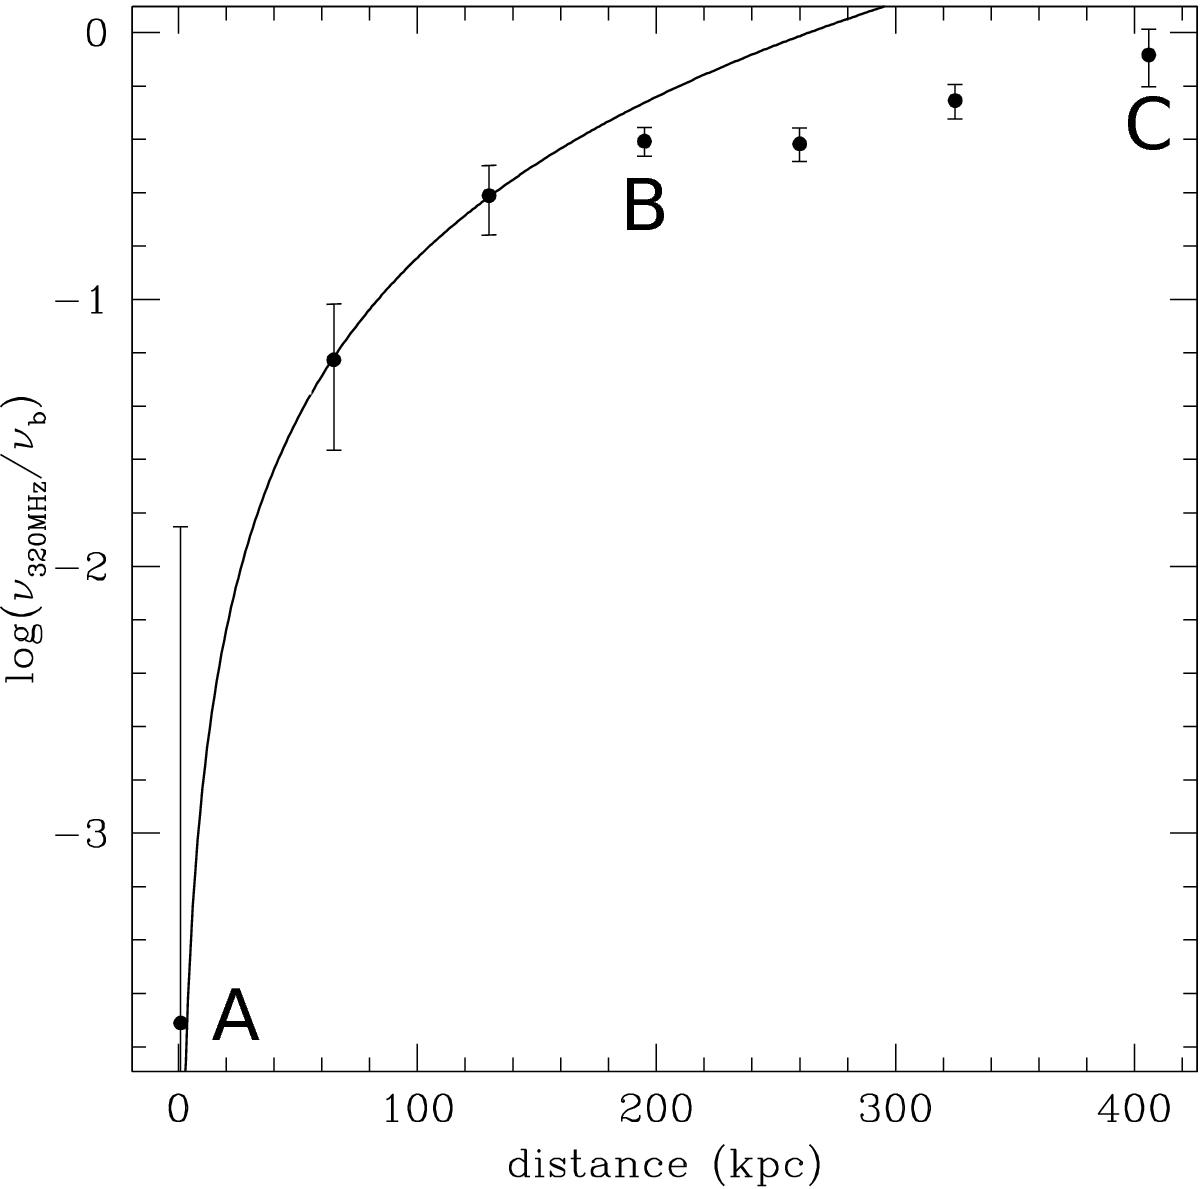
ν320 MHz/νb vs. distance from the “head” of the HT galaxy. The line represents νb ∝ d-2. For display purposes the curve is normalised to the third data point.
Current usage metrics show cumulative count of Article Views (full-text article views including HTML views, PDF and ePub downloads, according to the available data) and Abstracts Views on Vision4Press platform.
Data correspond to usage on the plateform after 2015. The current usage metrics is available 48-96 hours after online publication and is updated daily on week days.
Initial download of the metrics may take a while.