Free Access
Fig. 9
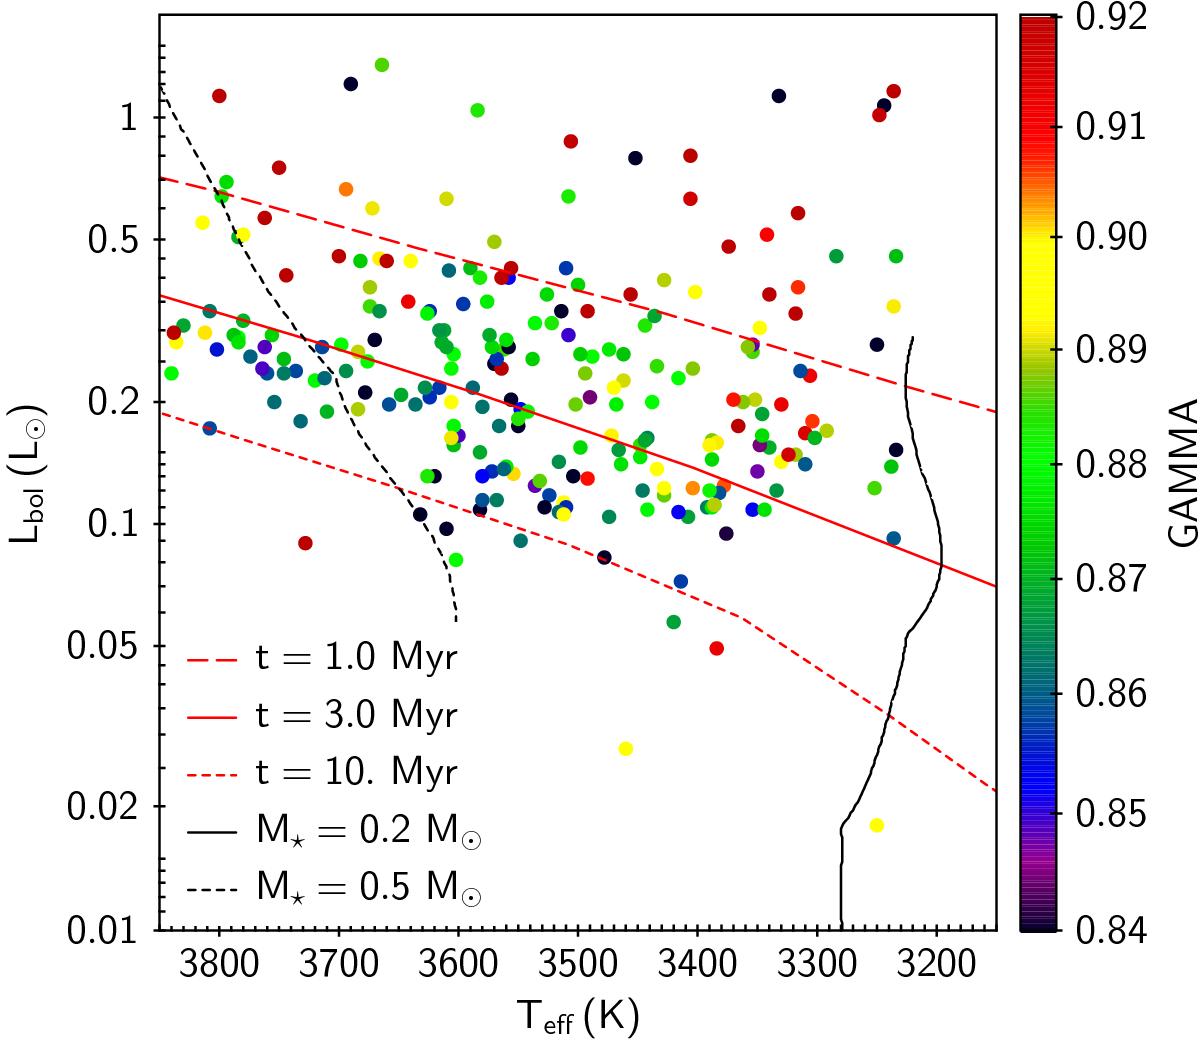
HR diagram of NGC 2264 members with Teff < 3850 K (M-type stars). Colors are scaled according to their γ-index (Damiani et al. 2014), as shown in the side axis. Mass tracks and isochrones traced on the diagram are from Baraffe et al.’s (2015) PMS evolutionary models.
Current usage metrics show cumulative count of Article Views (full-text article views including HTML views, PDF and ePub downloads, according to the available data) and Abstracts Views on Vision4Press platform.
Data correspond to usage on the plateform after 2015. The current usage metrics is available 48-96 hours after online publication and is updated daily on week days.
Initial download of the metrics may take a while.