Fig. 5
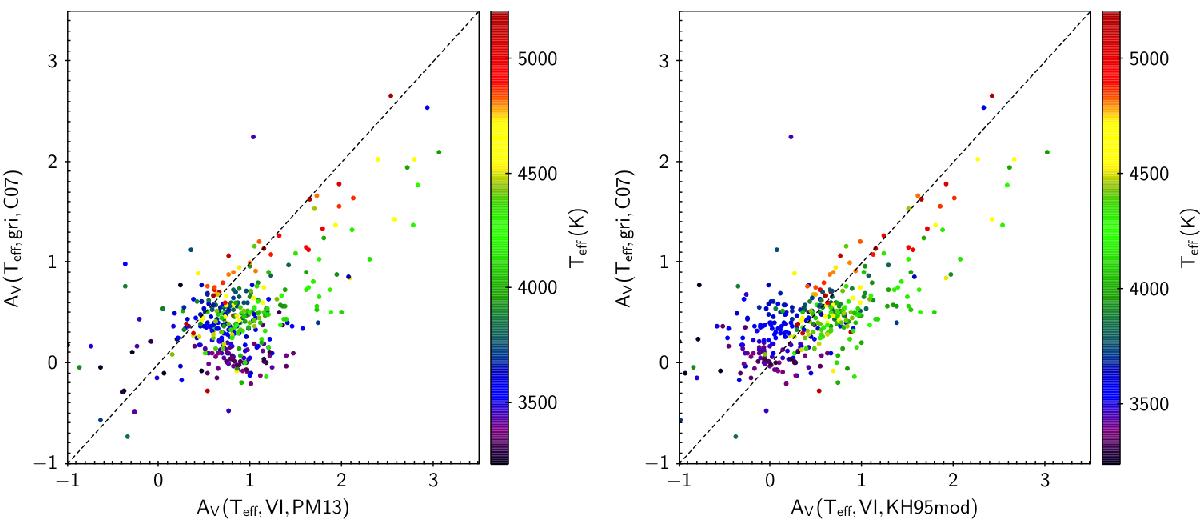
Left panel: comparison between the AV estimates derived for cluster members following methods 1. (y-axis) and 2. (x-axis) of Sect. 4.1. Right panel: comparison between the AV estimates derived following methods 1. (y-axis) and 3. (x-axis) of Sect. 4.1. Each dot corresponds to an object; colors are scaled according to the objects’ Teff, as shown on the side axes of the diagrams. The dashed lines trace the equality line on the diagrams.
Current usage metrics show cumulative count of Article Views (full-text article views including HTML views, PDF and ePub downloads, according to the available data) and Abstracts Views on Vision4Press platform.
Data correspond to usage on the plateform after 2015. The current usage metrics is available 48-96 hours after online publication and is updated daily on week days.
Initial download of the metrics may take a while.