Fig. 4
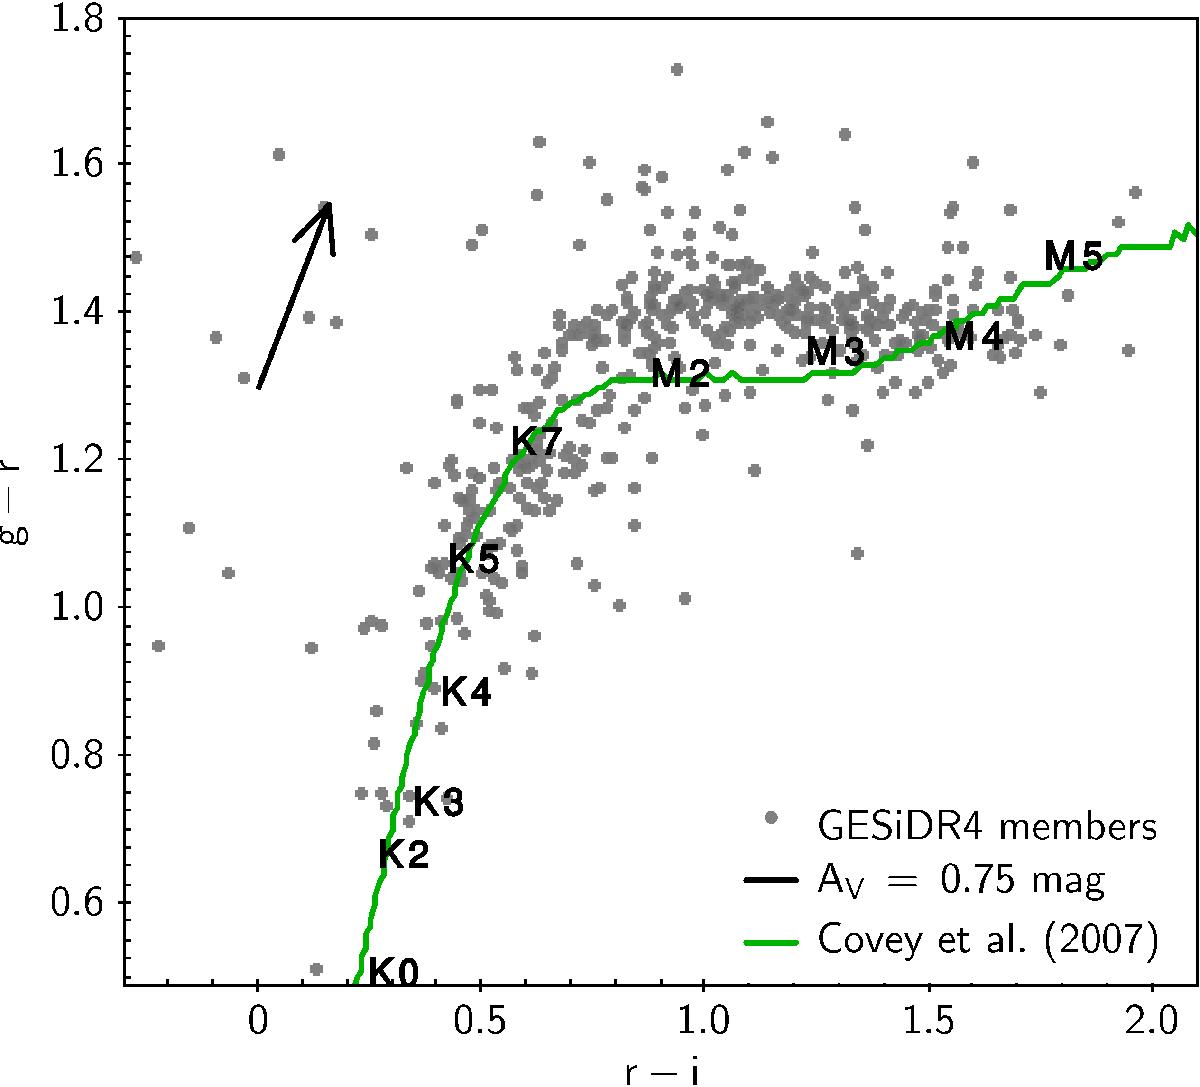
Distribution of NGC 2264 members on a g−r vs. r−i diagram, built using the SDSS-calibrated photometry obtained for the cluster with CFHT/MegaCam (Venuti et al. 2014). The green line shows the empirical, zero-reddening SpT–color stellar locus derived in the statistical study of Covey et al. (2007), recalibrated onto CFHT photometry as in Venuti et al. (2014). The reddening vector is traced following Fiorucci & Munari (2003).
Current usage metrics show cumulative count of Article Views (full-text article views including HTML views, PDF and ePub downloads, according to the available data) and Abstracts Views on Vision4Press platform.
Data correspond to usage on the plateform after 2015. The current usage metrics is available 48-96 hours after online publication and is updated daily on week days.
Initial download of the metrics may take a while.