Fig. 3
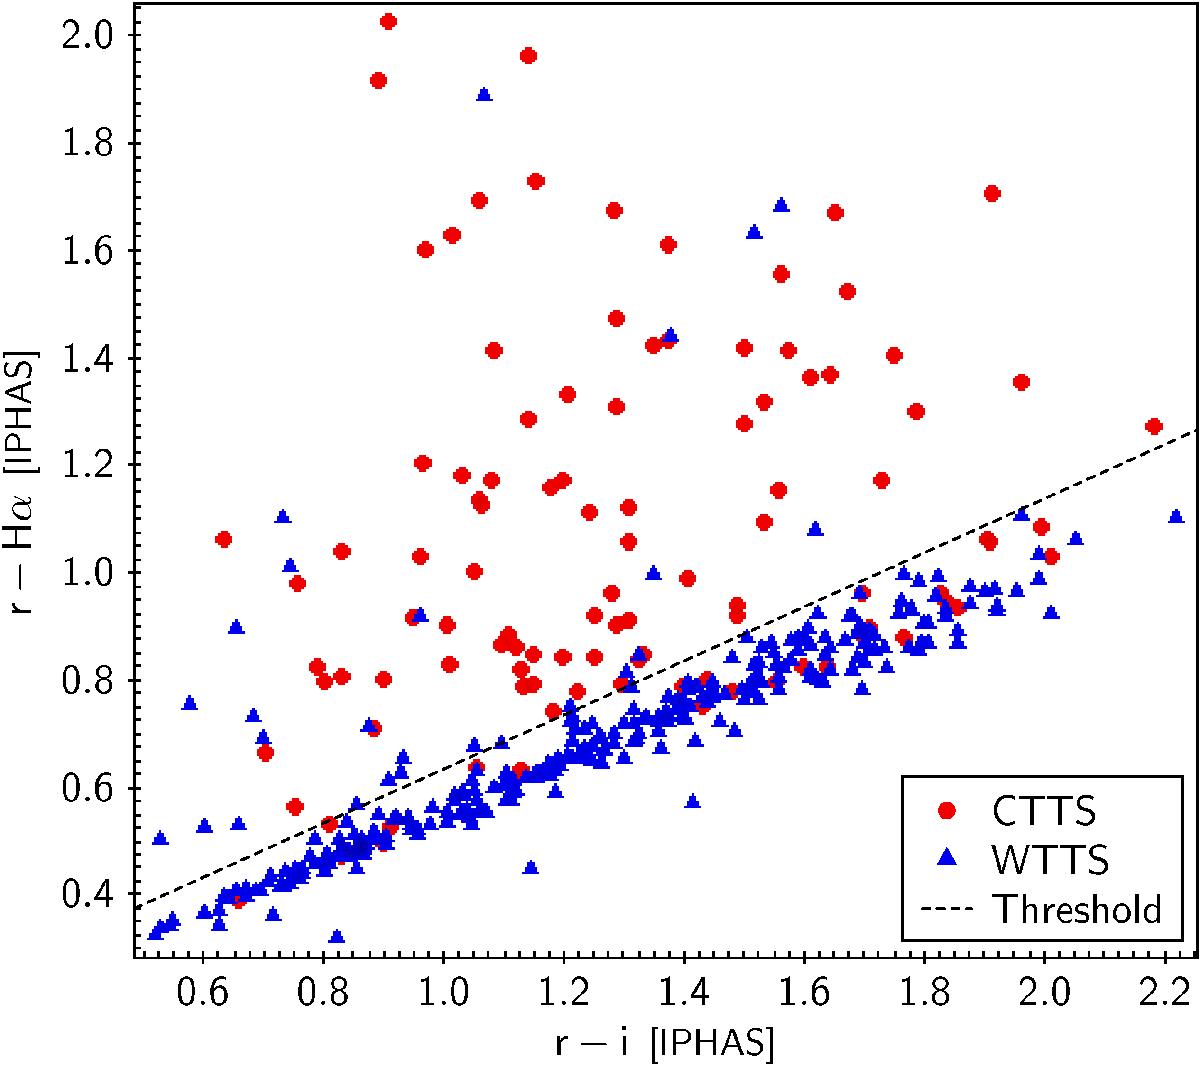
r−Hα vs. r−i color–color diagram using IPHAS photometry for NGC 2264 members in our sample classified as either accreting (CTTS, red dots) or non-accreting (WTTS, blue triangles) based on the UV excess measured for these sources in Venuti et al. (2014) from CSI 2264 CFHT photometry. The black dashed line is an empirical threshold traced following the locus of WTTS to separate the regions dominated by accreting vs. non-accreting objects; this threshold follows closely the unreddened MS track tabulated by Drew et al. (2005) on the r−Hα vs. r−i diagram.
Current usage metrics show cumulative count of Article Views (full-text article views including HTML views, PDF and ePub downloads, according to the available data) and Abstracts Views on Vision4Press platform.
Data correspond to usage on the plateform after 2015. The current usage metrics is available 48-96 hours after online publication and is updated daily on week days.
Initial download of the metrics may take a while.