Fig. 11
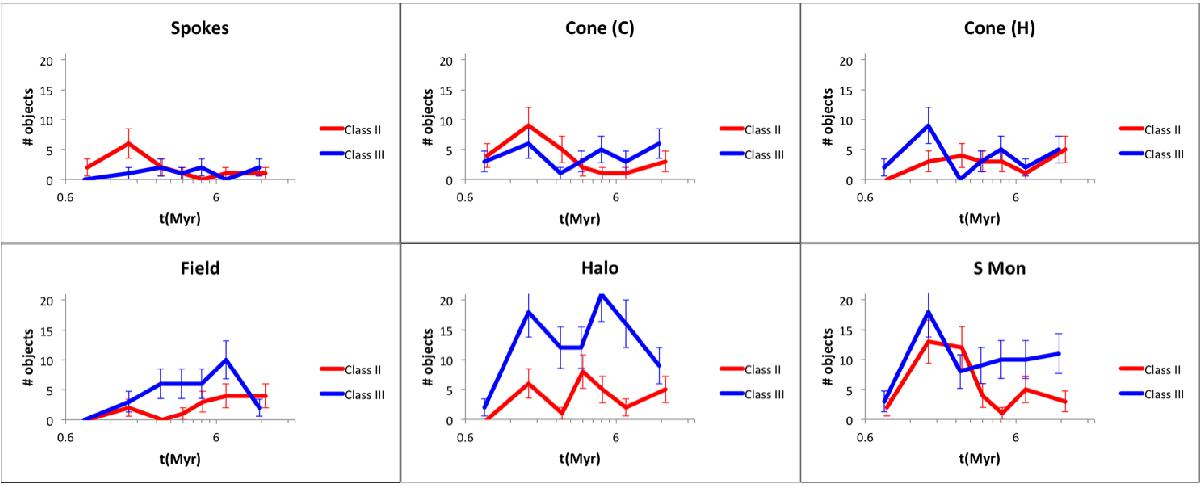
Graphic representation of the data in Table 3. Each panel illustrates the number of Class II (red) and Class III (blue) objects of a given age projected onto one of the six NGC 2264 subregions shown in Fig. 10. The x-axis coordinates correspond to the median isochronal ages computed for Class II and Class III objects in each age bin. The y-axis values can be derived from Table 3 by multiplying the total number of objects at a given age by the corresponding percentage in each region. The vertical error bars correspond to the Poissonian errors on the counts in each bin.
Current usage metrics show cumulative count of Article Views (full-text article views including HTML views, PDF and ePub downloads, according to the available data) and Abstracts Views on Vision4Press platform.
Data correspond to usage on the plateform after 2015. The current usage metrics is available 48-96 hours after online publication and is updated daily on week days.
Initial download of the metrics may take a while.