Fig. 1
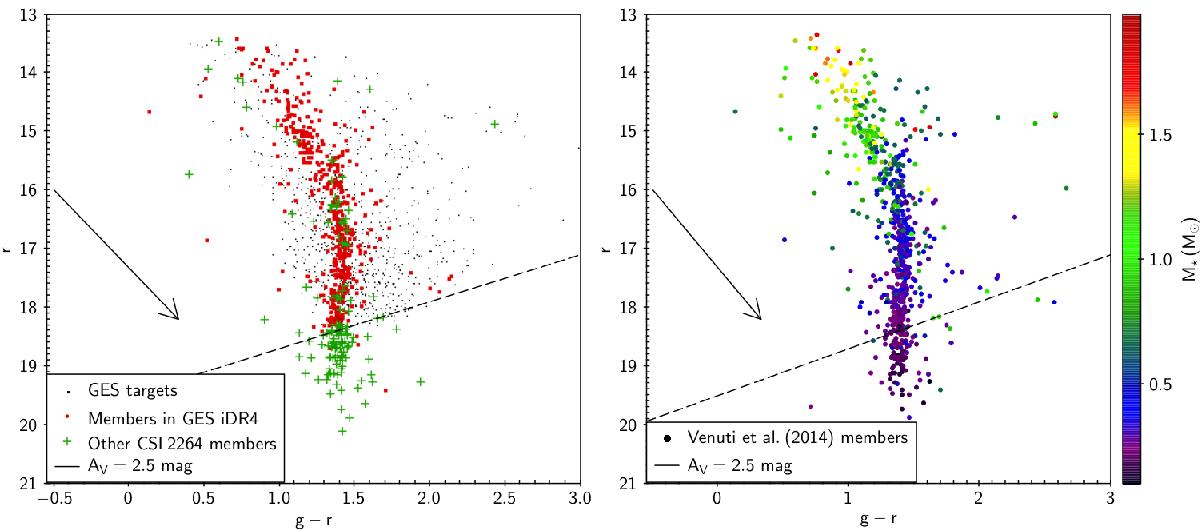
Left panel: (g−r, r) CMD of the NGC 2264 region. The photometry used was acquired at the CFHT during the CSI 2264 campaign and is presented in Venuti et al. (2014). The different subgroups of objects shown on the diagram are: i) all objects in the NGC 2264 region with observations in the GES database (black dots); ii) GES targets classified as members as described in Sect. 3.1 (red dots); iii) additional confirmed or probable members, retrieved from the CSI 2264 catalog, that were not observed during the GES campaign (green crosses). The reddening vector is traced following the prescriptions of Fiorucci & Munari (2003) in the SDSS photometric system. The black dashed line is traced by eye along the faint magnitude edge of the distribution of GES targets on the diagram to better visualize the magnitude limit of the GES observing run on NGC 2264. Right panel: same photometric diagram shown in the left panel, but for NGC 2264 cluster members investigated in Venuti et al. (2014). Colors are scaled according to stellar mass (derived in Venuti et al. 2014, using PMS evolutionary tracks from the models of Siess et al. 2000), as indicated in the side axis. The diagrams depict, for illustration purposes, only objects that have g,r,i photometry from the CSI 2264 CFHT survey of the cluster. These amount to 73% of the total sample of GES targets, 76% of cluster members included in GESiDR4, and 32% of the additional cluster members that appear in the CSI 2264 catalog of the region but are not included in the GES sample. However, we did explore a variety of photometric datasets to include a maximum of objects in our statistical evaluation of sample completeness, and could ascertain that the respective distributions observed here for the various subsamples are representative of the full samples (that is, irrespective of the photometric dataset considered, we consistently find that about 80% of known cluster members with no data in GESiDR4 lie below the faint mag limit of the GESiDR4 sample).
Current usage metrics show cumulative count of Article Views (full-text article views including HTML views, PDF and ePub downloads, according to the available data) and Abstracts Views on Vision4Press platform.
Data correspond to usage on the plateform after 2015. The current usage metrics is available 48-96 hours after online publication and is updated daily on week days.
Initial download of the metrics may take a while.