Fig. 7
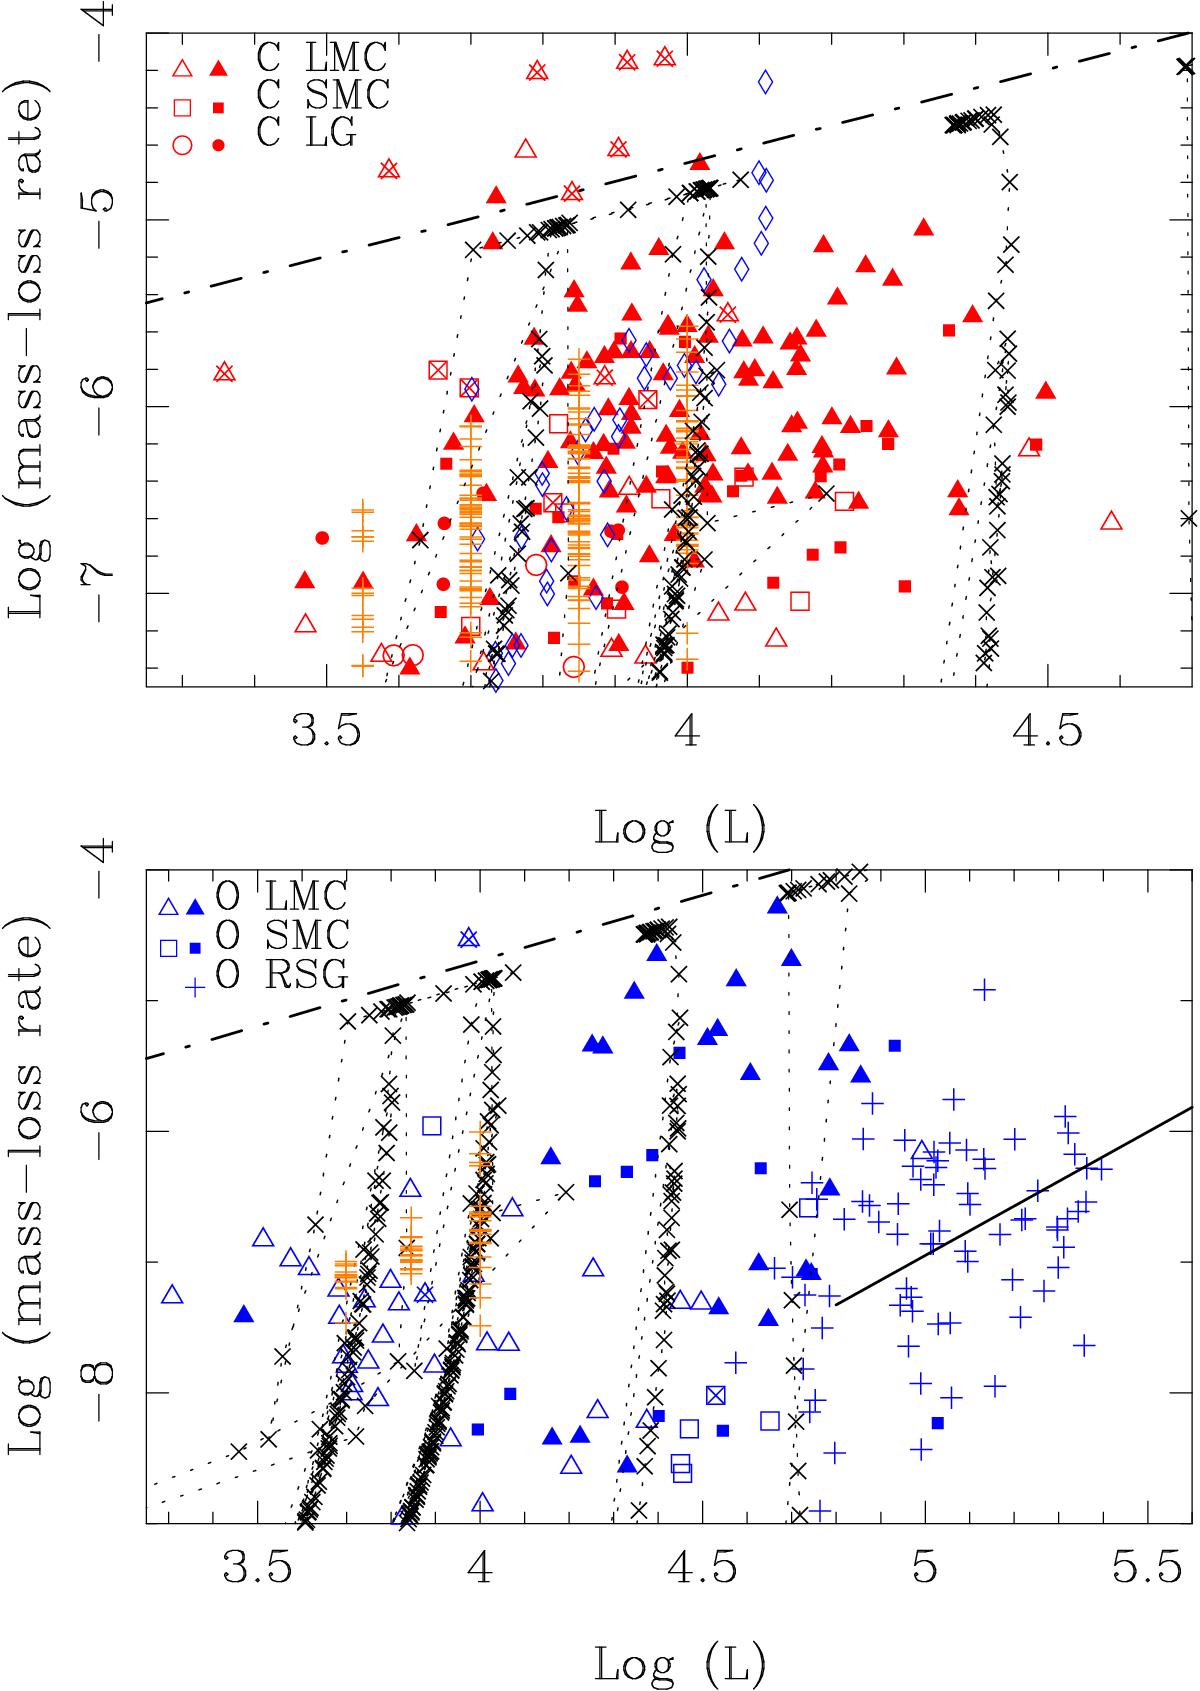
Total MLR vs. luminosity for C stars (top panel, red colours) and M stars (bottom panel, blue colours). Objects with Mira-like pulsation amplitudes are plotted with filled symbols; objects with smaller amplitudes with open symbols. An overplotted cross indicates no information on pulsation properties. Orange plus signs in the top panel indicate models by Eriksson et al. (2014) scaled to our adopted dust-to-gas ratio and expansion velocity (see text). Blue diamonds in the top panel indicate a sample of Galactic C Miras (see text). RSGs are plotted as plus signs independent of host galaxy and pulsation amplitude. Orange plus signs in the bottom panel indicate models by Bladh et al. (2015) scaled to our adopted dust-to-gas ratio and expansion velocity (see text). The VW models for LMC metallicity are plotted as crosses connected by the dotted lines for initial masses of 1.5, 2.5, 5.0, and 7.9 M⊙, but not every track is visible in every panel. Each cross represents a time interval of 5000 yr. The dot-dashed line shows the single scattering limit for a velocity of 10 km s-1. The solid line is the relation found by Verhoelst et al. (2009) for Galactic RSGs.
Current usage metrics show cumulative count of Article Views (full-text article views including HTML views, PDF and ePub downloads, according to the available data) and Abstracts Views on Vision4Press platform.
Data correspond to usage on the plateform after 2015. The current usage metrics is available 48-96 hours after online publication and is updated daily on week days.
Initial download of the metrics may take a while.