Fig. 5
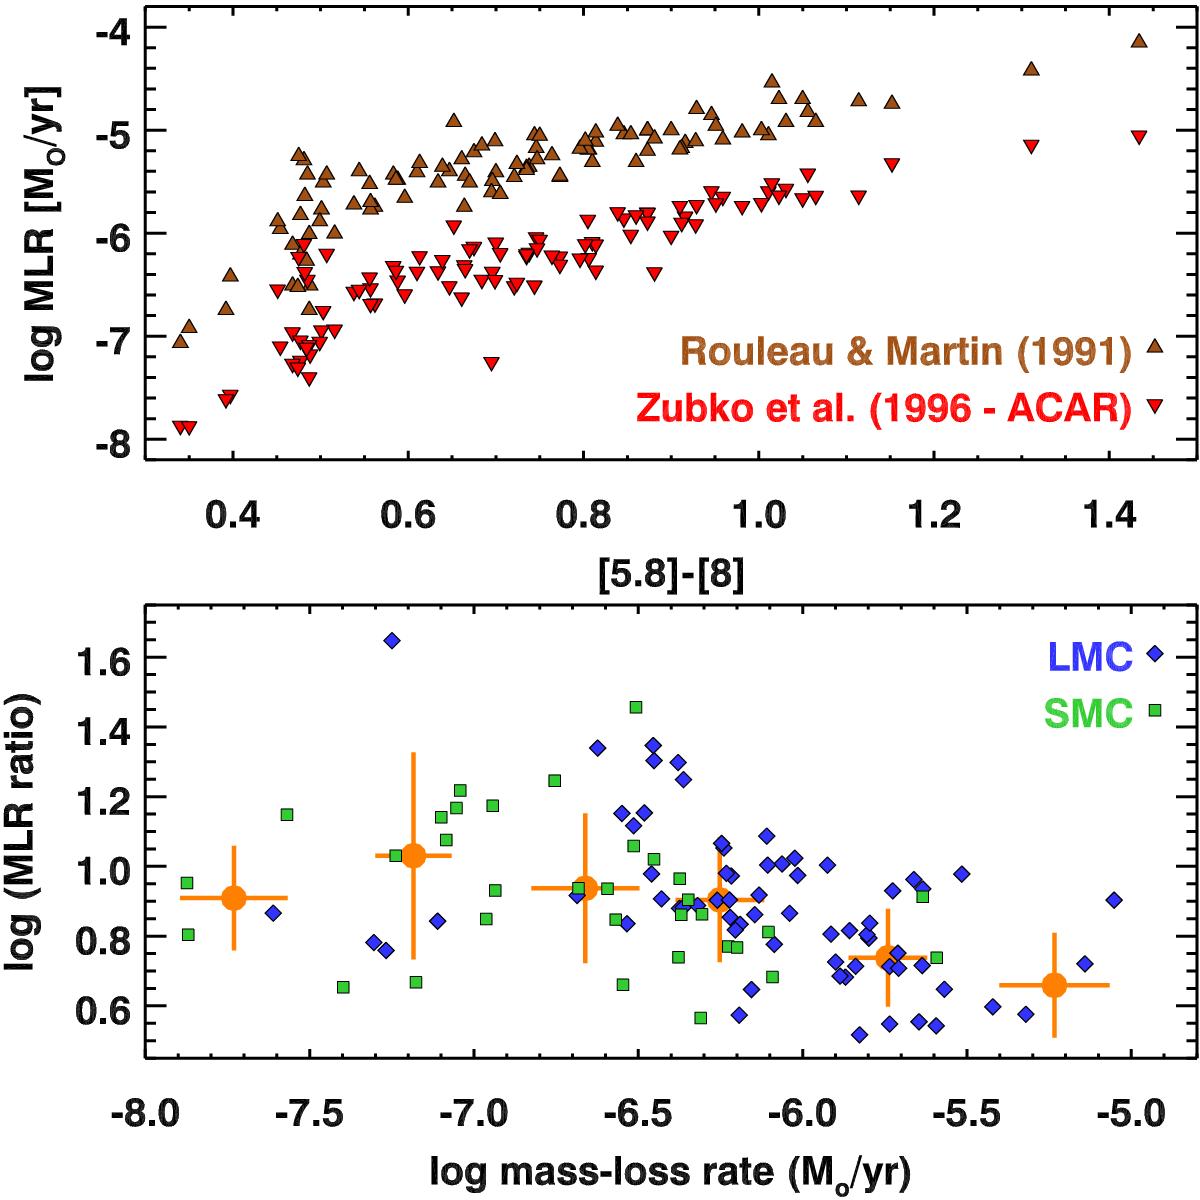
Comparison of the mass-loss rates for carbon stars between the present work and G09. The current work uses optical constants for amorphous carbon from Zubko et al. (1996), while G09 used constants from Rouleau & Martin (1991). Top: a direct comparison for the common sources shows that the new models have much lower MLRs. Bottom: ratios of the MLRs tend to be approximately nine, although the difference between the models drops for the highest MLRs. The gold data points in the bottom panel are the median values for the log of the MLR ratio in each 0.5 dex bin, plotted against the mean log MLR; the error bars are the formal standard deviations.
Current usage metrics show cumulative count of Article Views (full-text article views including HTML views, PDF and ePub downloads, according to the available data) and Abstracts Views on Vision4Press platform.
Data correspond to usage on the plateform after 2015. The current usage metrics is available 48-96 hours after online publication and is updated daily on week days.
Initial download of the metrics may take a while.