Fig. 3
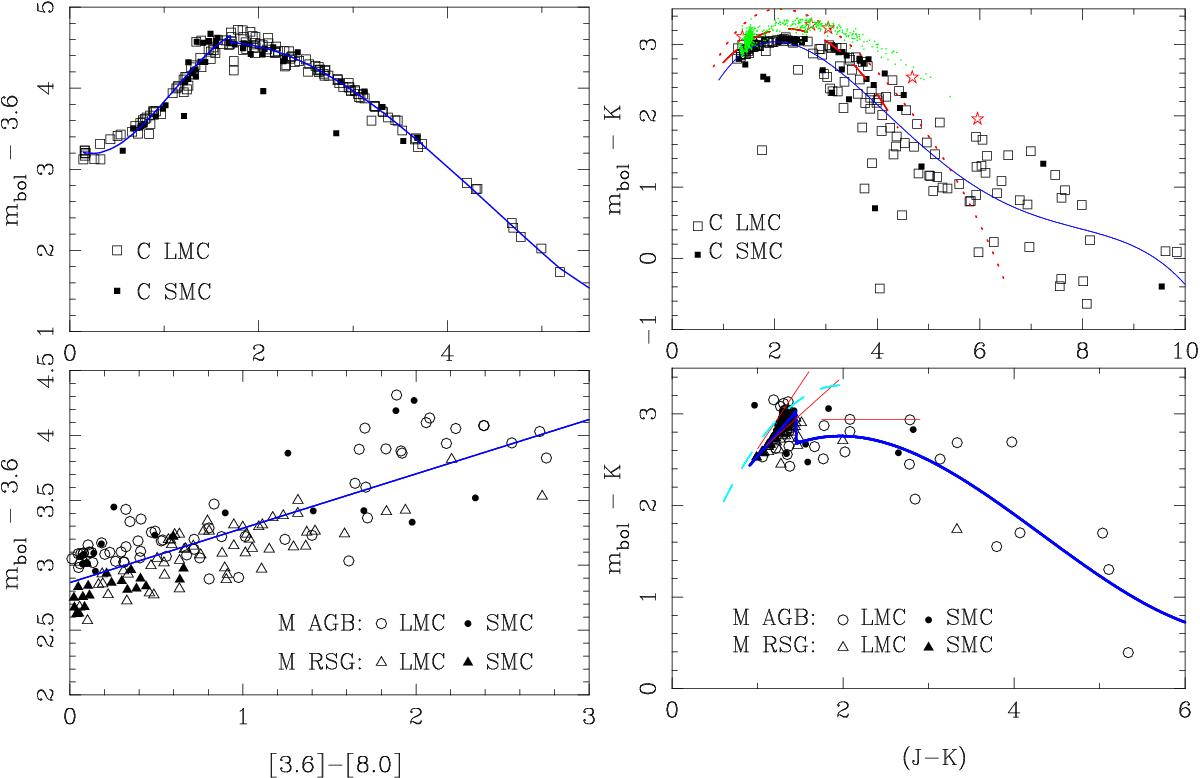
Bolometric correction at 3.6 μm vs. [3.6]−[8.0] colour (left) and K vs. J−K colour (right) for C stars (top panels) and M stars (bottom panels). The solid dark-blue lines are polynomial fits to the data (see Table 2). See Sect. 5.2 for an explanation of sources not fitted or plotted. For C stars in the top right panel, red stars indicate models by Nowotny et al. (2013), green dots indicate models by Eriksson (2014), the dotted red line indicates the fit by Kerschbaum et al. (2010), and the dashed red line indicates the fit by Whitelock et al. (2006). For M stars in the lower-right panel, the straight red lines indicate relations “A”, “B”, and “C” from Kerschbaum et al. (2010), valid in the range 1.0 <J−K< 1.6, 1.1 <J−K< 1.95, and 1.75 <J−K< 2.9 mag, respectively. The dashed light blue line indicates the fit by WBF.
Current usage metrics show cumulative count of Article Views (full-text article views including HTML views, PDF and ePub downloads, according to the available data) and Abstracts Views on Vision4Press platform.
Data correspond to usage on the plateform after 2015. The current usage metrics is available 48-96 hours after online publication and is updated daily on week days.
Initial download of the metrics may take a while.