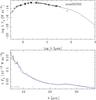
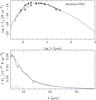
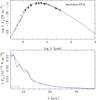
Fig. B.1
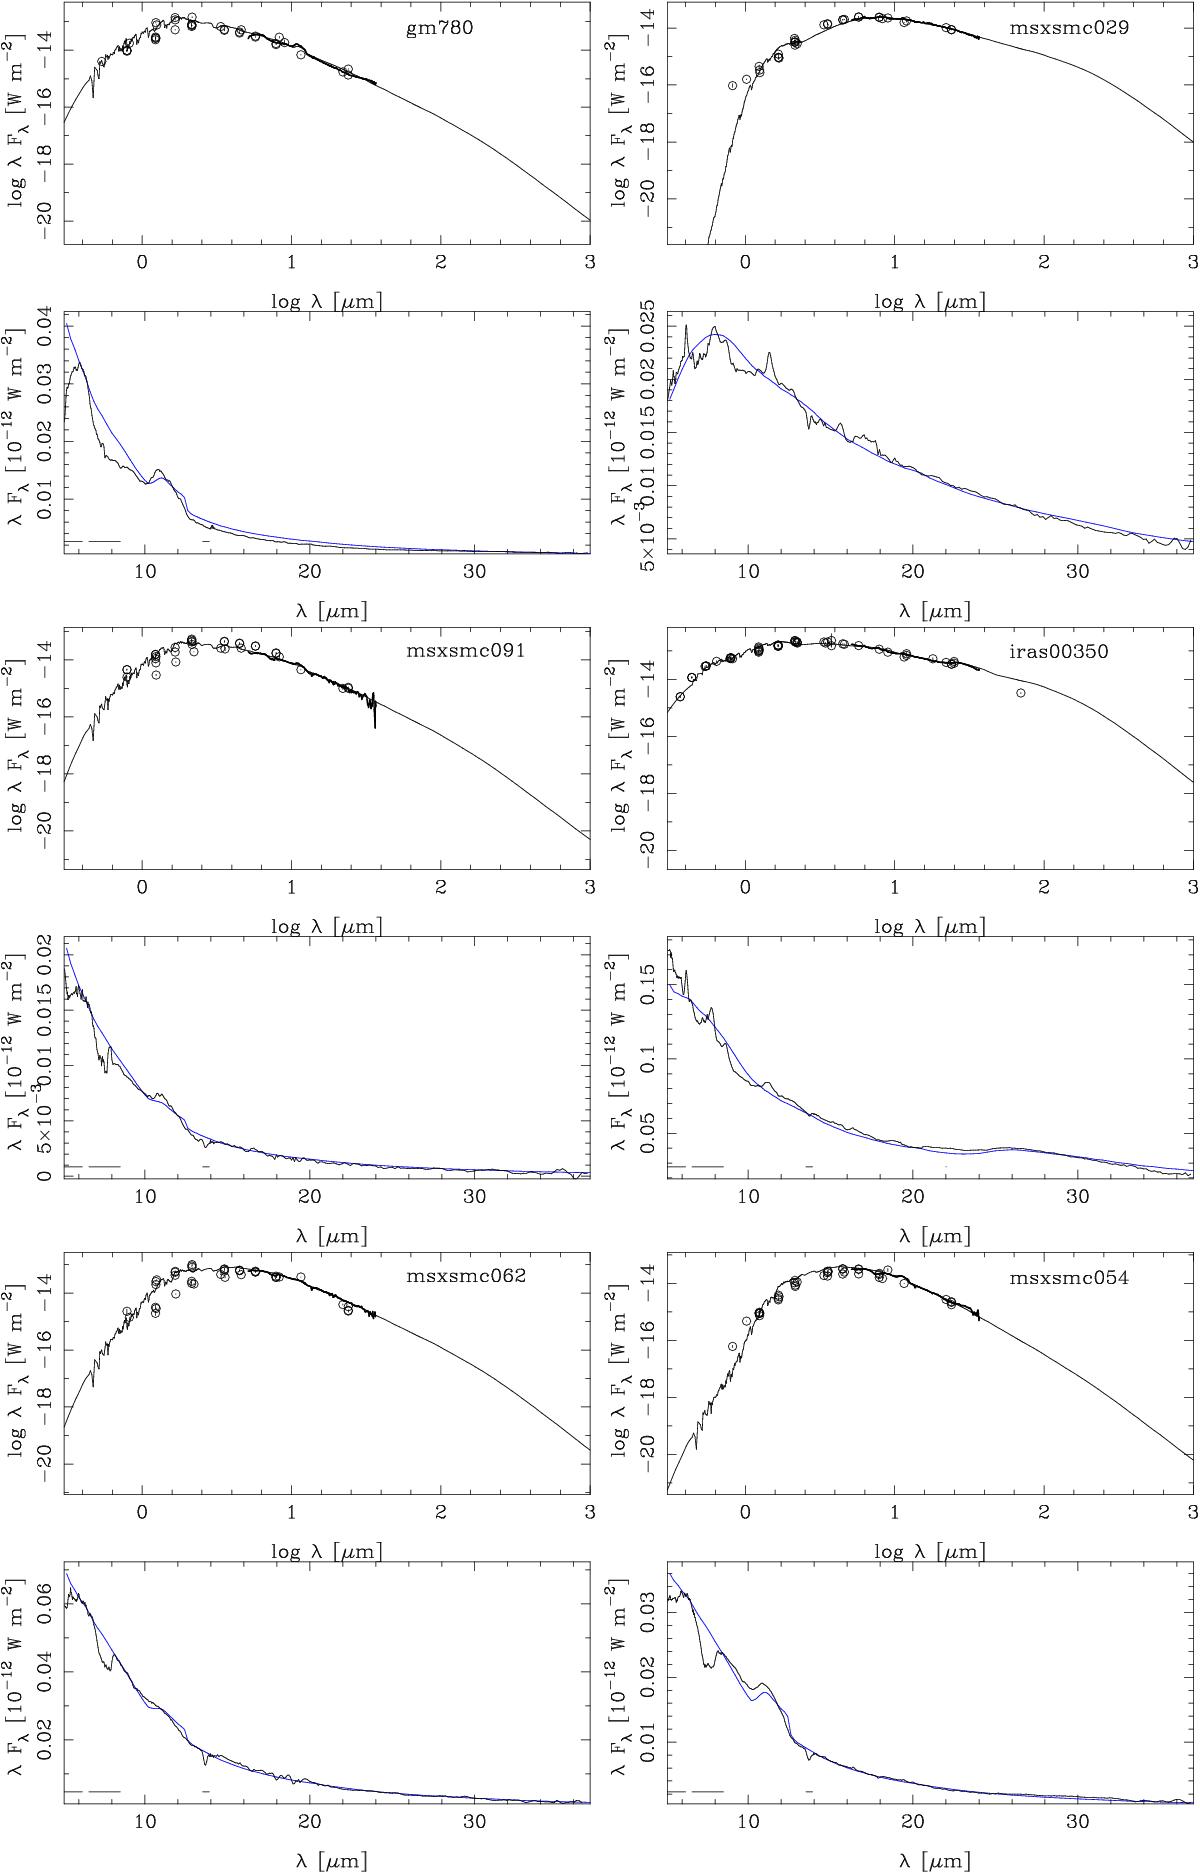
Fits to the SEDs and IRS spectra of C stars. In the upper panel the model (the continuous line) is shown with the IRS spectrum and the photometric points on a logarithmic scale. The lower panel shows the IRS spectrum and model in more detail on a linear scale. The model has been fit to the data by scaling to a quasi-continuum point based on the average flux in the 6.4–6.5 μm region. Horizontal lines near the bottom indicate wavelength regions excluded from the fit.
Current usage metrics show cumulative count of Article Views (full-text article views including HTML views, PDF and ePub downloads, according to the available data) and Abstracts Views on Vision4Press platform.
Data correspond to usage on the plateform after 2015. The current usage metrics is available 48-96 hours after online publication and is updated daily on week days.
Initial download of the metrics may take a while.