Fig. 3
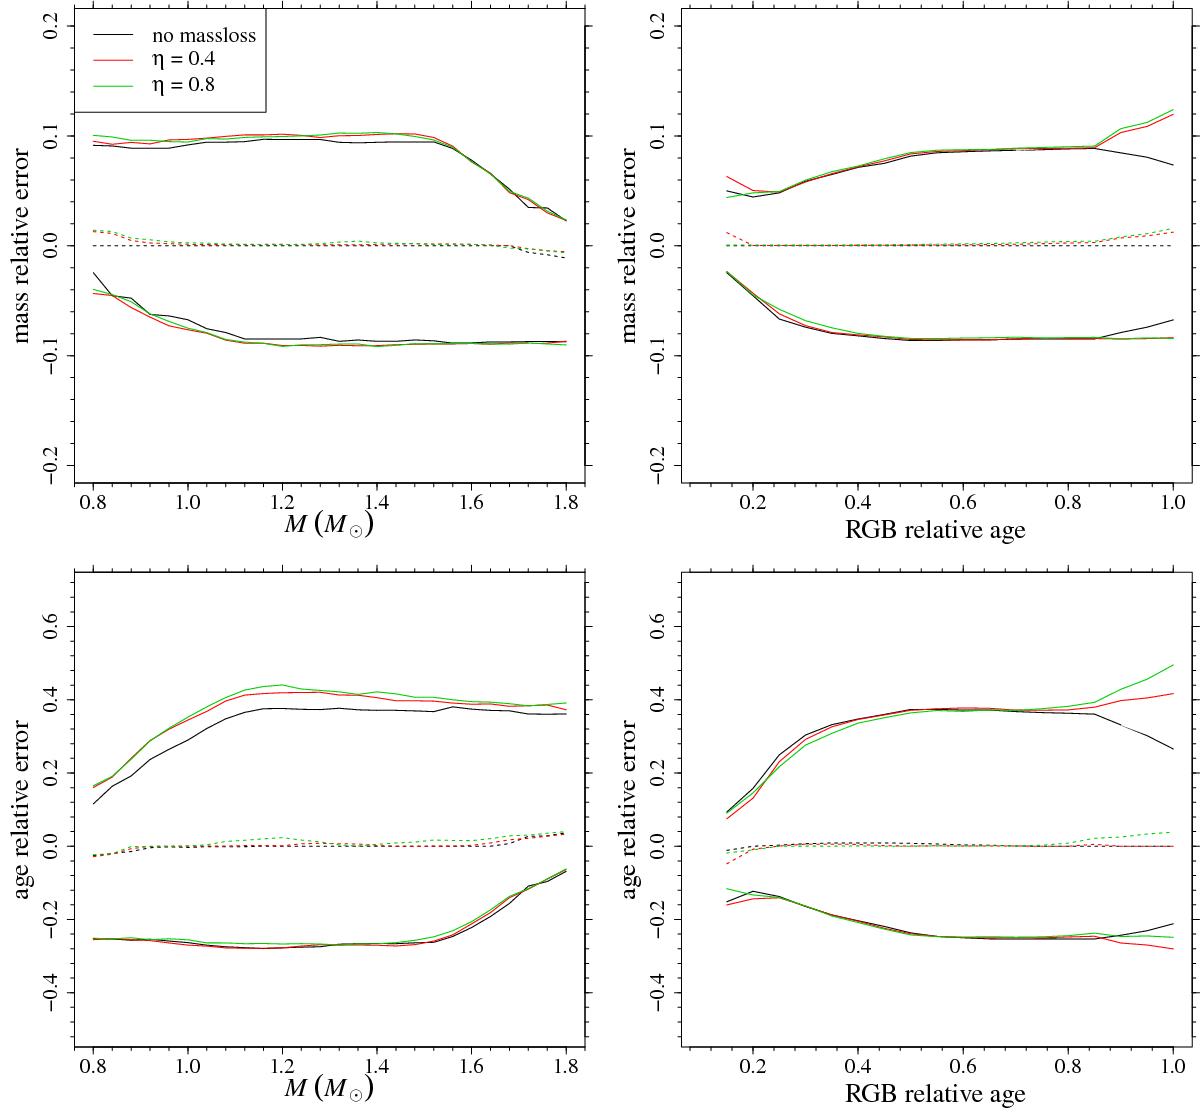
Top row, left: Monte Carlo 1σ envelope on the estimated mass as a function of the true mass of the star. The black solid line shows the relative error 1σ envelope for the no mass loss sampling and reconstruction, the red line refers to the sampling from the grid with η = 0.4 and reconstruction on the grid with η = 0.0, while the green one to the sampling from η = 0.8 grid and reconstruction on the grid with η = 0.0. The dotted lines mark the medians. Right: as in the left panel, but as function of the RGB relative age of the stars. Bottom row: as in the top row, but for the age relative error.
Current usage metrics show cumulative count of Article Views (full-text article views including HTML views, PDF and ePub downloads, according to the available data) and Abstracts Views on Vision4Press platform.
Data correspond to usage on the plateform after 2015. The current usage metrics is available 48-96 hours after online publication and is updated daily on week days.
Initial download of the metrics may take a while.