Fig. 1
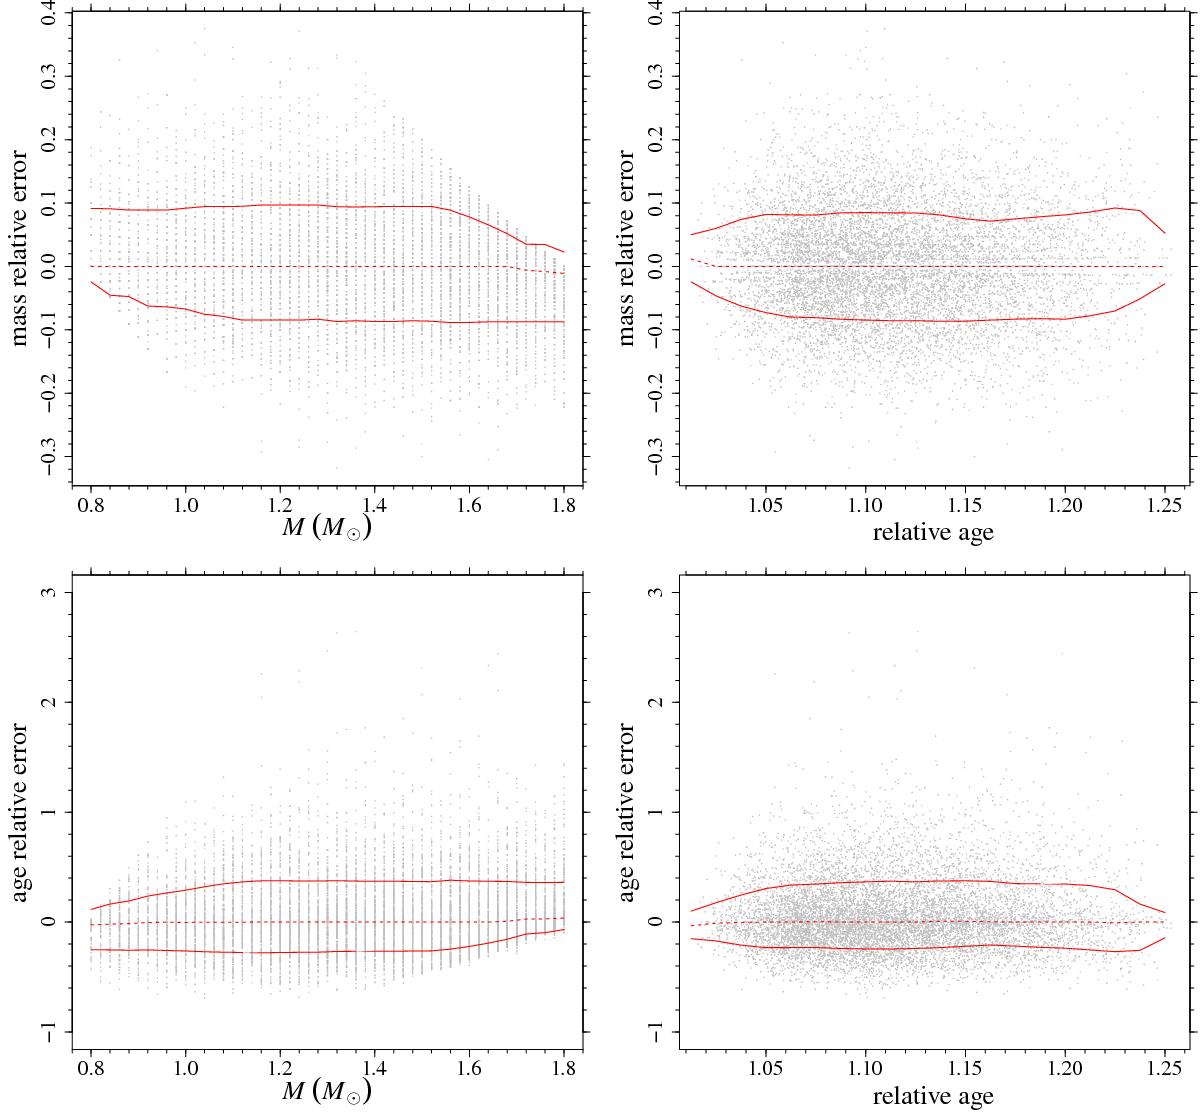
Top row, left: Monte Carlo relative error – only due to observational errors – on the mass as a function of the true mass of the star. The red line shows the relative error 1σ envelope. Right: as in the left panel, but as function of the relative age of the stars. The figure shows only the RGB evolution (see text). Bottom row: as in the top row, but for the age relative error.
Current usage metrics show cumulative count of Article Views (full-text article views including HTML views, PDF and ePub downloads, according to the available data) and Abstracts Views on Vision4Press platform.
Data correspond to usage on the plateform after 2015. The current usage metrics is available 48-96 hours after online publication and is updated daily on week days.
Initial download of the metrics may take a while.