Fig. 12
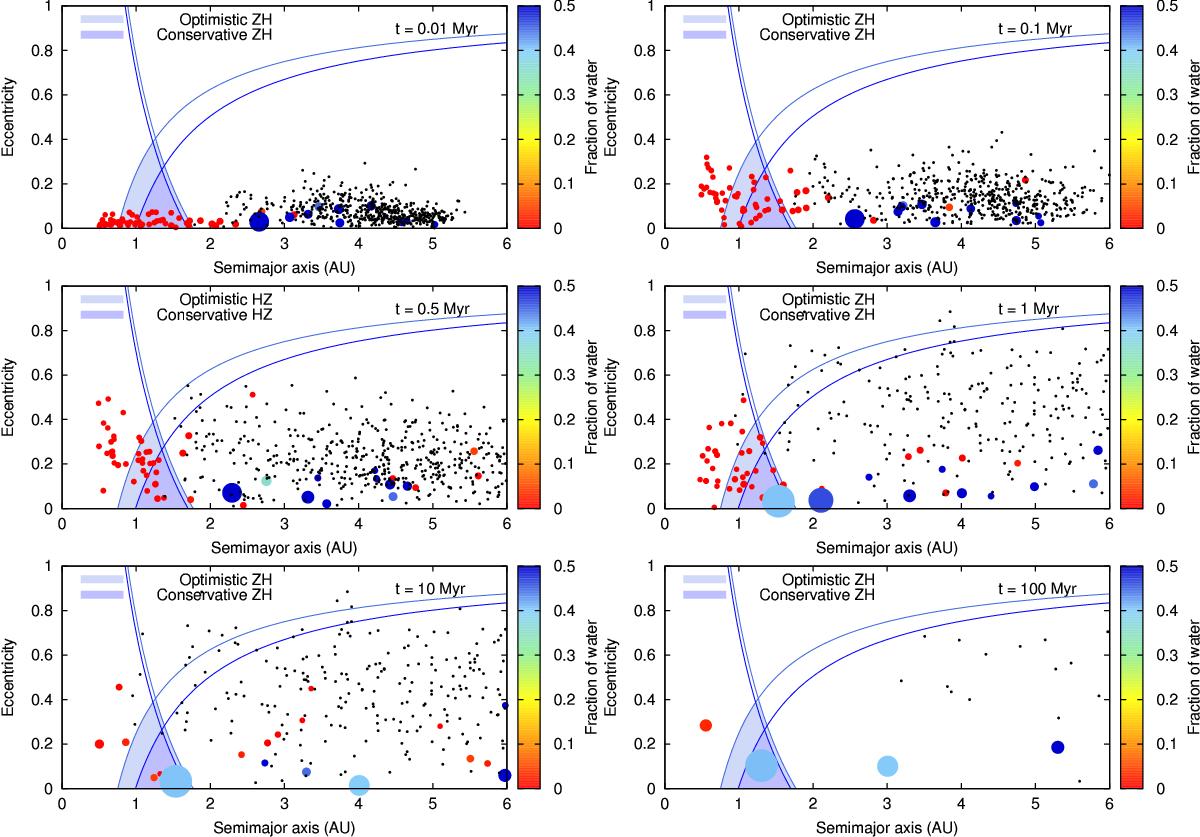
Evolution in time of SIM 1 corresponding to scenario IV. Planetary embryos are plotted as colored circles following the color scale that represents the fraction of water of the embryos with respect to their total masses. The blue and light blue shaded areas represent the conservative and the optimistic HZ, respectively. Moreover, the blue and light blue curves represent curves of constant perihelion and aphelion, both for the conservative and the optimistic HZ. At the end of the simulation, a super-Earth of 8.29M⊕ and 40% water content survives within the limits of the HZ. It is worth noting that the accretion seed of this planet is the 5M⊕ super-Earth formed at 3 au at the end of the gaseous phase.
Current usage metrics show cumulative count of Article Views (full-text article views including HTML views, PDF and ePub downloads, according to the available data) and Abstracts Views on Vision4Press platform.
Data correspond to usage on the plateform after 2015. The current usage metrics is available 48-96 hours after online publication and is updated daily on week days.
Initial download of the metrics may take a while.