Fig. 5
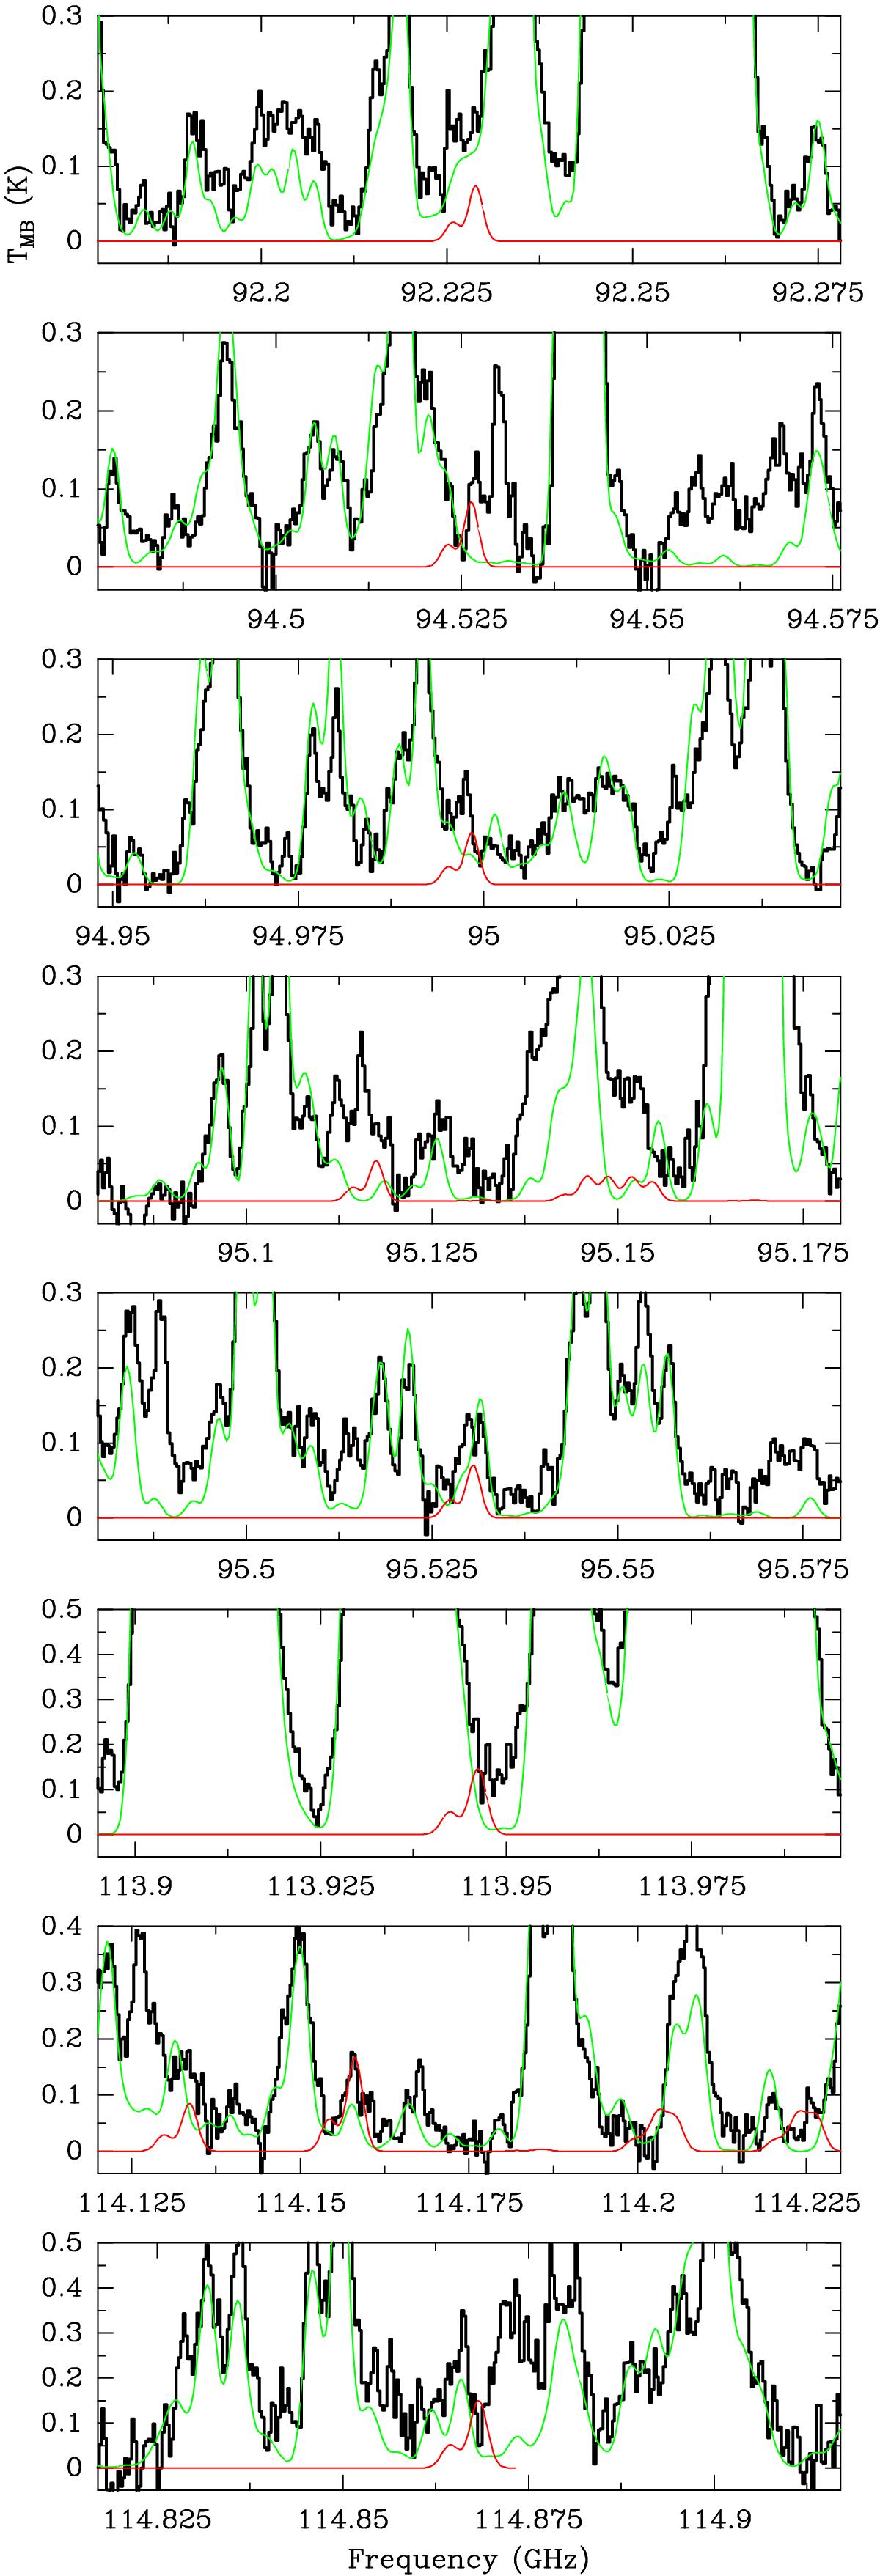
Lines partially free of blending of CH3ONH2 in Sgr B2(N) at 3 mm. The observed data (black histogram spectrum) and total model of the source (green curve) are taken from Belloche et al. (2013). The synthetic spectrum for methoxyamine corresponding to the upper limit reported in Table 2 is given by the red line. A vLSR of +64.0 km s-1 is assumed.
Current usage metrics show cumulative count of Article Views (full-text article views including HTML views, PDF and ePub downloads, according to the available data) and Abstracts Views on Vision4Press platform.
Data correspond to usage on the plateform after 2015. The current usage metrics is available 48-96 hours after online publication and is updated daily on week days.
Initial download of the metrics may take a while.