Fig. 4
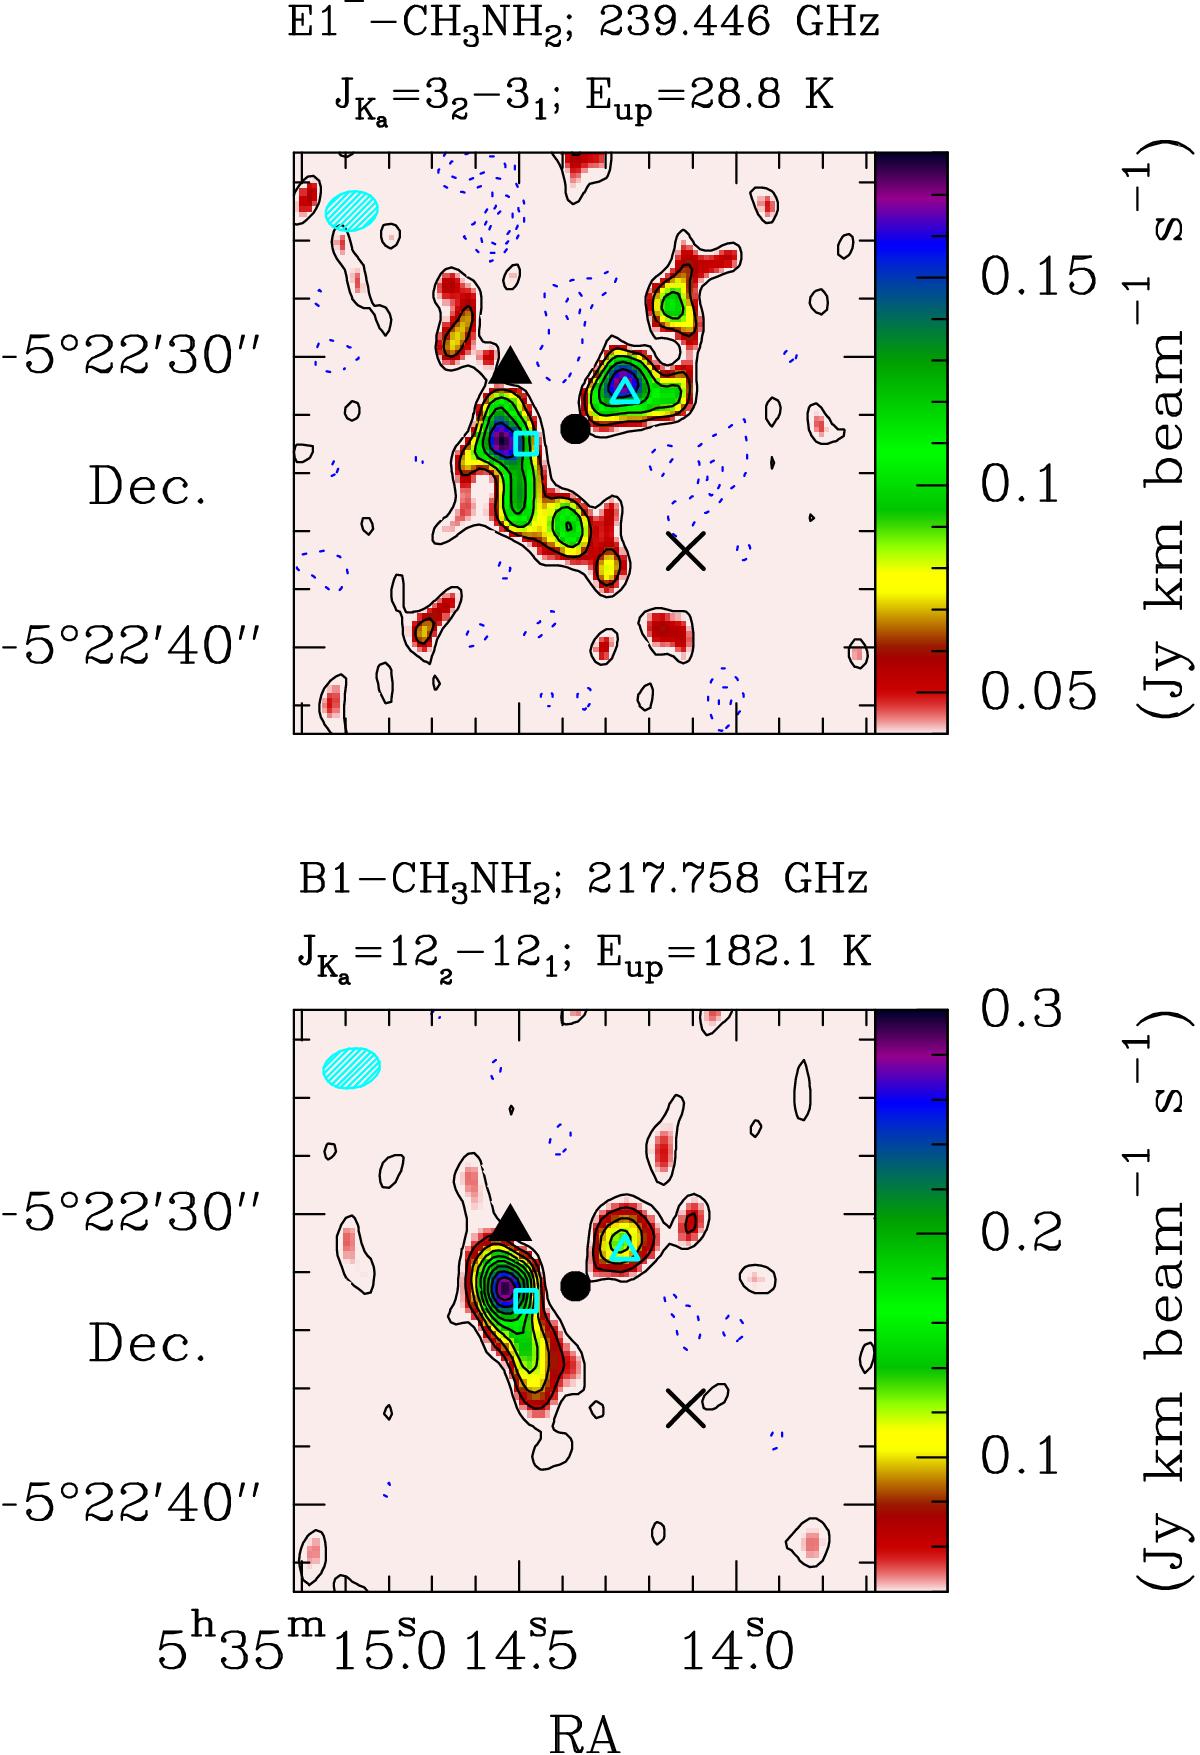
Spatial distribution of CH3NH2 in Orion KL. The data are from ALMA SV observations. The interval of contours in black is 0.03 Jy beam-1 km s-1, and the minimum contour is 0.03 Jy beam-1 km s-1. Negative flux is represented by the blue dashed contours: the minimum contour is −0.05 Jy beam-1 km s-1 and the interval is −0.03 Jy beam-1 km s-1. The cyan ellipse in the top left corner of the maps represents the synthetic beam. The black triangle shows source I, the black circle shows source n, the cross represents the compact ridge, and the cyan unfilled square and triangle indicate Positions A and B (see Sect. 4).
Current usage metrics show cumulative count of Article Views (full-text article views including HTML views, PDF and ePub downloads, according to the available data) and Abstracts Views on Vision4Press platform.
Data correspond to usage on the plateform after 2015. The current usage metrics is available 48-96 hours after online publication and is updated daily on week days.
Initial download of the metrics may take a while.