Fig. 5
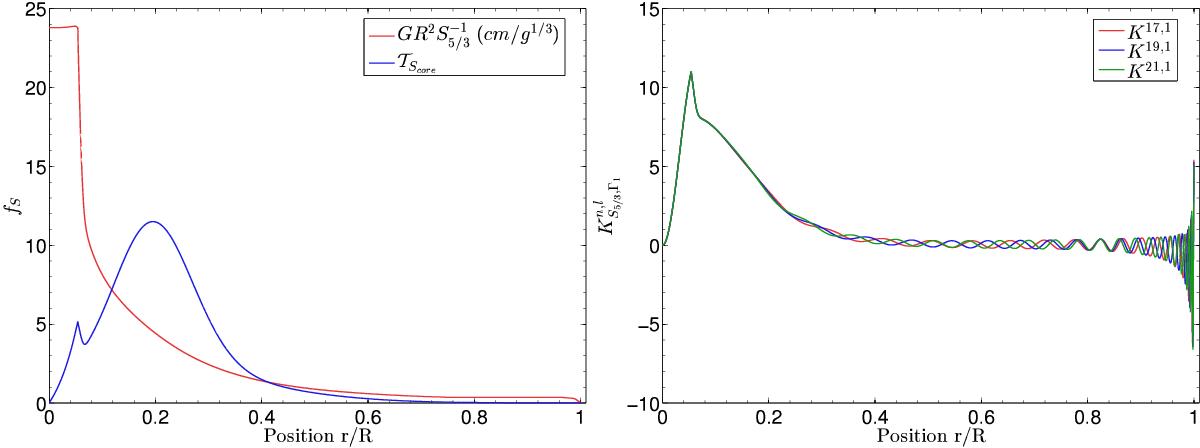
Left panel: structural profile of ![]() in red, showing the plateau in the convective core. In blue, an example of the adaptation of a target function to include the trace of the convective core and its border. The target function is plotted in its non-dimensional form. Right panel: structural kernels associated with S5/3 in the (S5/3,Γ1) structural pair, showing the trace of the entropy plateau in the convective core in the central regions. The model used is Target 6 of Table 3. The kernels are plotted in their non-dimensional form.
in red, showing the plateau in the convective core. In blue, an example of the adaptation of a target function to include the trace of the convective core and its border. The target function is plotted in its non-dimensional form. Right panel: structural kernels associated with S5/3 in the (S5/3,Γ1) structural pair, showing the trace of the entropy plateau in the convective core in the central regions. The model used is Target 6 of Table 3. The kernels are plotted in their non-dimensional form.
Current usage metrics show cumulative count of Article Views (full-text article views including HTML views, PDF and ePub downloads, according to the available data) and Abstracts Views on Vision4Press platform.
Data correspond to usage on the plateform after 2015. The current usage metrics is available 48-96 hours after online publication and is updated daily on week days.
Initial download of the metrics may take a while.