Fig. 11
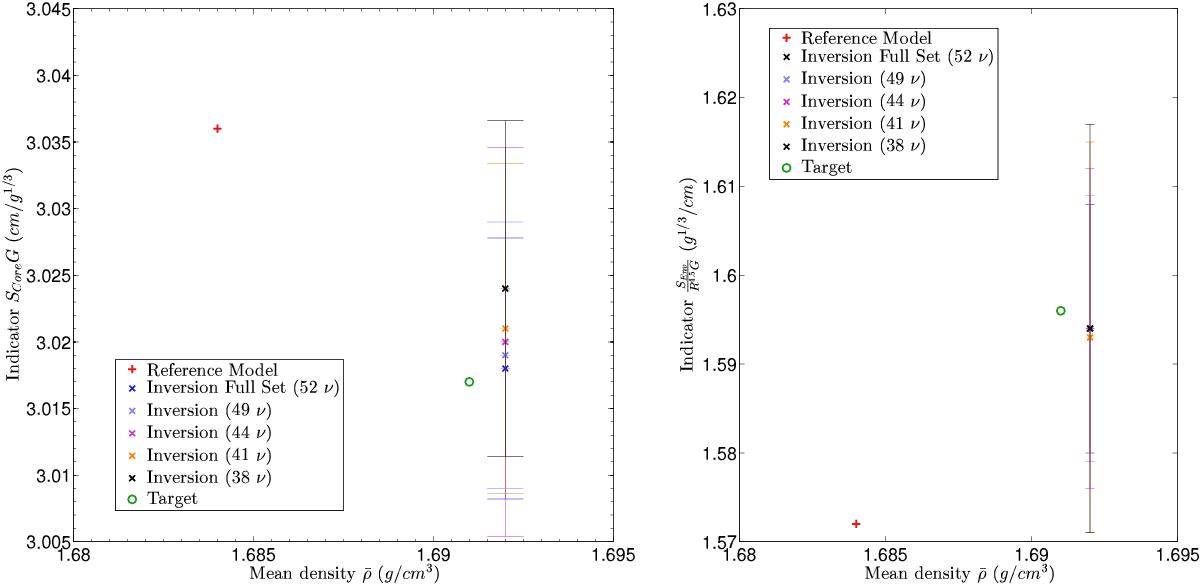
Left panel: illustration of the accuracy of the inversion of the SCore indicator illustrated in a ![]() plane for various numbers of observed frequencies. The reference values are given in red, the target values are plotted in green and the inverted values are plotted in various colors according to the number of observed frequencies. Right panel: same for the SEnv indicator.
plane for various numbers of observed frequencies. The reference values are given in red, the target values are plotted in green and the inverted values are plotted in various colors according to the number of observed frequencies. Right panel: same for the SEnv indicator.
Current usage metrics show cumulative count of Article Views (full-text article views including HTML views, PDF and ePub downloads, according to the available data) and Abstracts Views on Vision4Press platform.
Data correspond to usage on the plateform after 2015. The current usage metrics is available 48-96 hours after online publication and is updated daily on week days.
Initial download of the metrics may take a while.