Free Access
Fig. 7
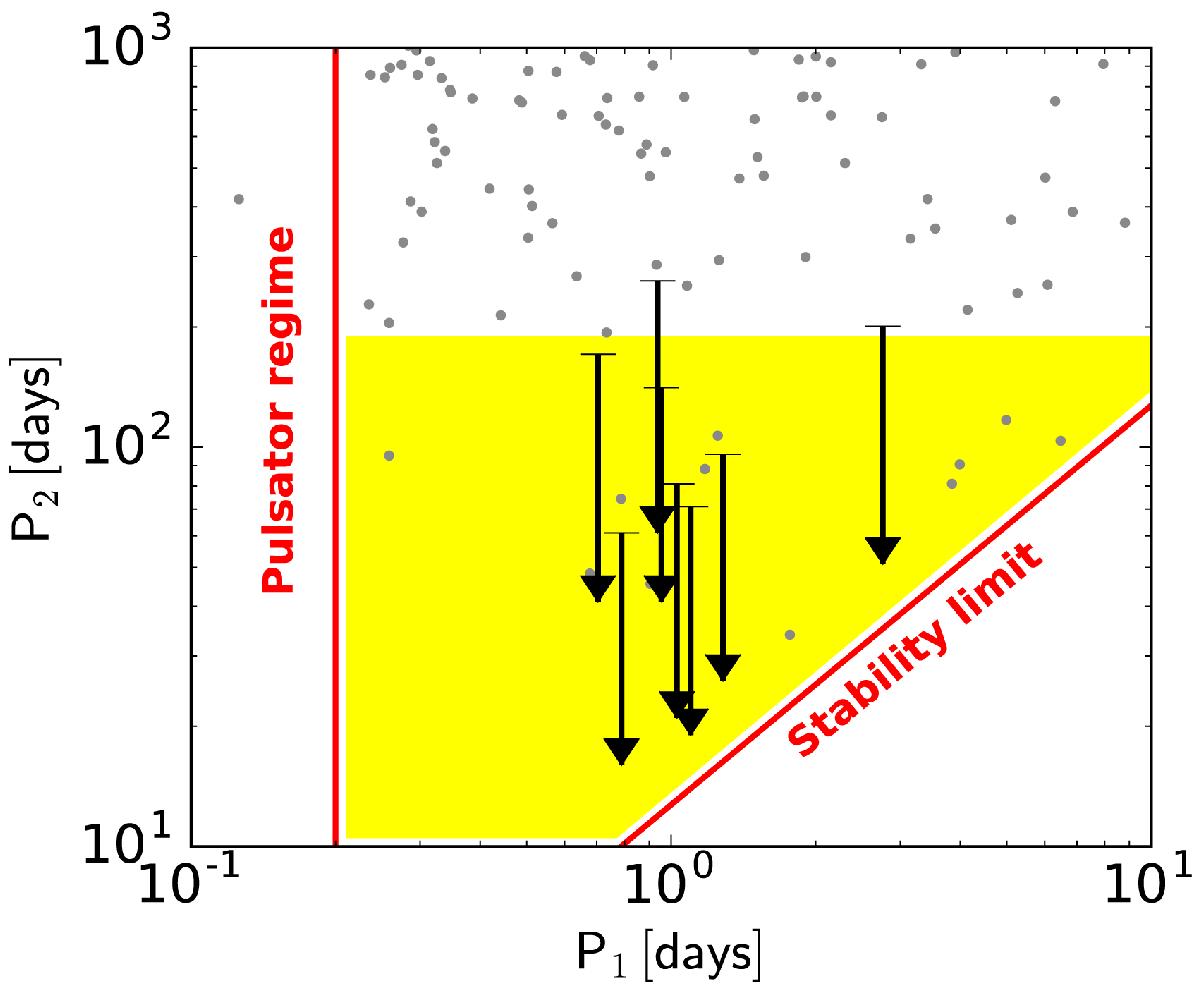
Area with the lack of triples in P1−P2 distribution with the systems studied in this work. As only upper limit on P2 has been estimated, each system is depicted like an arrow with upper limit. Triples found within the Kepler field are marked with a gray dots.
Current usage metrics show cumulative count of Article Views (full-text article views including HTML views, PDF and ePub downloads, according to the available data) and Abstracts Views on Vision4Press platform.
Data correspond to usage on the plateform after 2015. The current usage metrics is available 48-96 hours after online publication and is updated daily on week days.
Initial download of the metrics may take a while.