Fig. 5
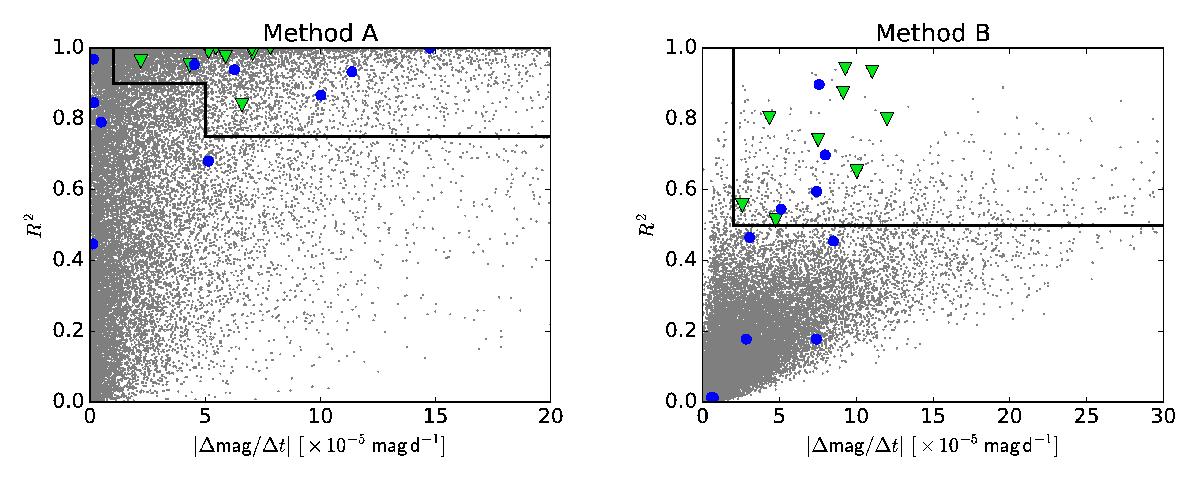
All eclipsing binaries from the OGLE III LMC database (gray dots) plotted in the (slope, R2) parameter space of both methods. Nineteen previously known systems showing variations of the LC amplitude are marked with blue circles (artefacts or systems with rapid changes of amplitude) and green triangles (systems with approximately linear amplitude change on the timescale of observation). Our setting of thresholds is shown as a black line.
Current usage metrics show cumulative count of Article Views (full-text article views including HTML views, PDF and ePub downloads, according to the available data) and Abstracts Views on Vision4Press platform.
Data correspond to usage on the plateform after 2015. The current usage metrics is available 48-96 hours after online publication and is updated daily on week days.
Initial download of the metrics may take a while.