Free Access
Fig. 4
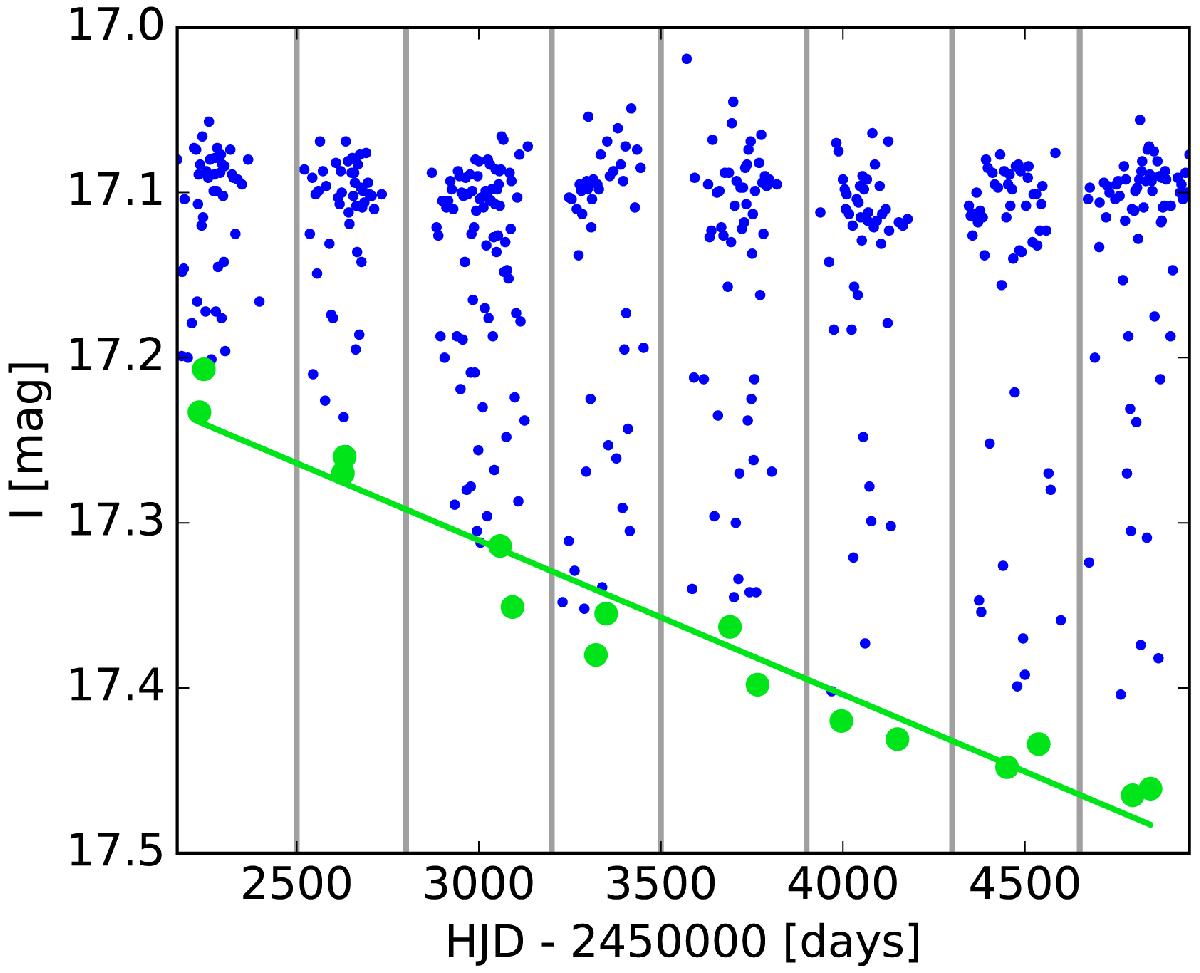
Demonstration of Method B. Example LC of the system OGLE-LMC-ECL-01350 splitted into 8 intervals according to observational seasons. The lowest two points inside each interval are plotted with green circles, the green line shows the linear fit.
Current usage metrics show cumulative count of Article Views (full-text article views including HTML views, PDF and ePub downloads, according to the available data) and Abstracts Views on Vision4Press platform.
Data correspond to usage on the plateform after 2015. The current usage metrics is available 48-96 hours after online publication and is updated daily on week days.
Initial download of the metrics may take a while.