Fig. 2
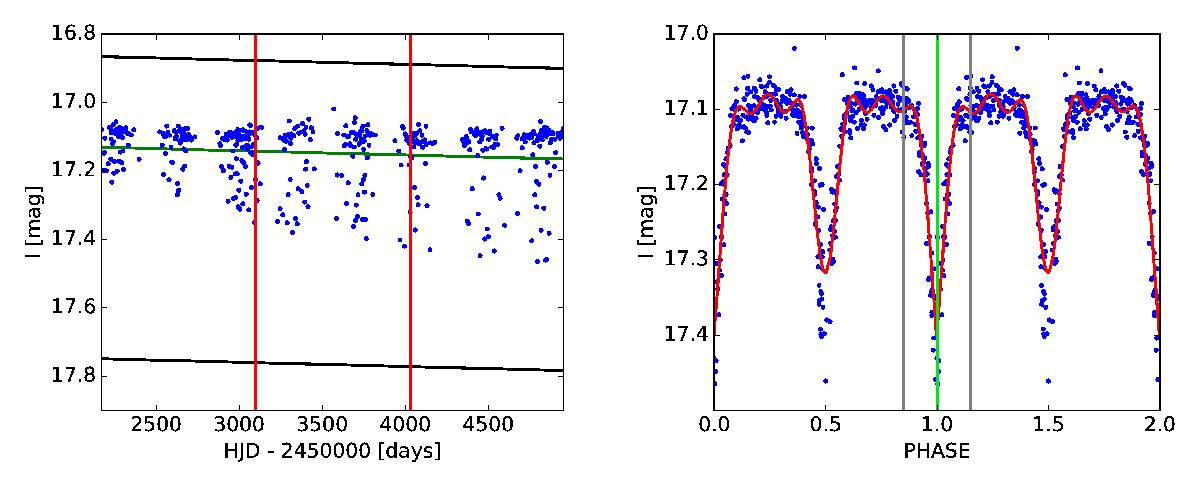
Demonstration of Method A. Left: example LC of the system OGLE-LMC-ECL-01350 divided to three intervals. Green line represents linear fit, black lines show the limits for removal of the outliers (−3σ, +7σ). Right: phase curve for the whole LC fitted with a Fourier series of the 5th order (red line). Green line marks detected primary minimum, gray lines represent detected region of the drop in brightness.
Current usage metrics show cumulative count of Article Views (full-text article views including HTML views, PDF and ePub downloads, according to the available data) and Abstracts Views on Vision4Press platform.
Data correspond to usage on the plateform after 2015. The current usage metrics is available 48-96 hours after online publication and is updated daily on week days.
Initial download of the metrics may take a while.