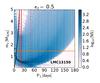
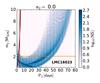
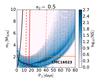
Fig. E.1
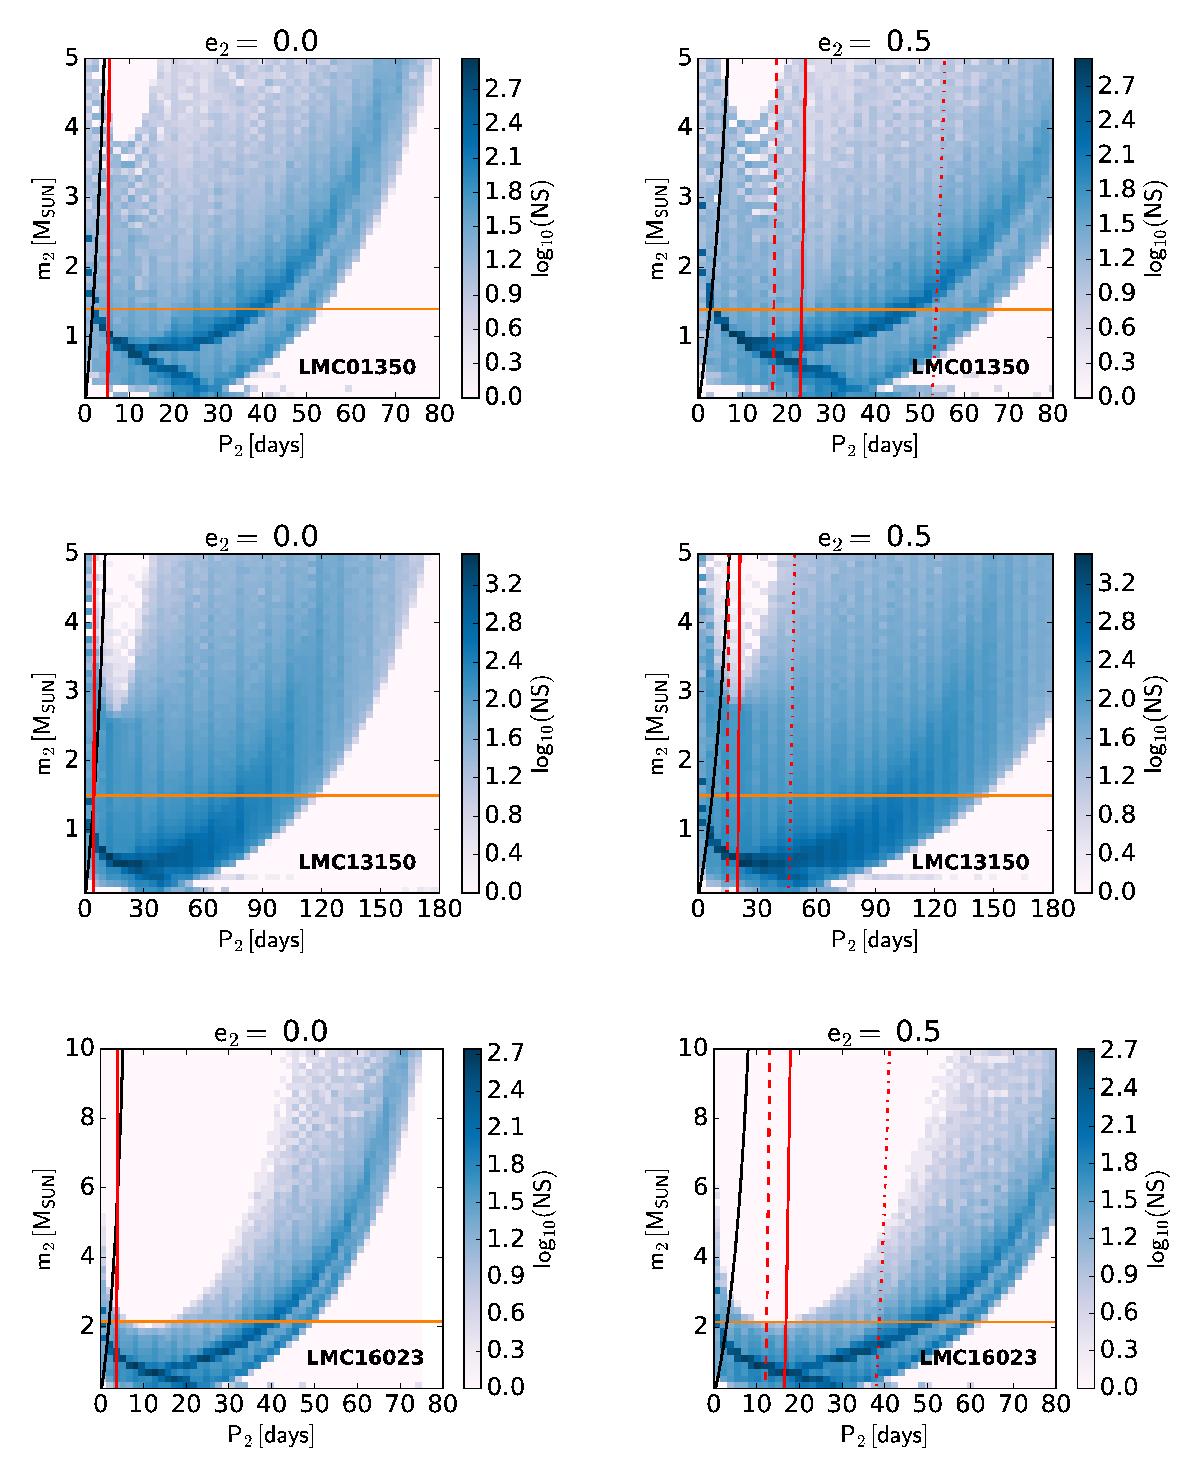
Possible masses and periods of third bodies. All solutions from 68.3 % area in the Fig. D.1 for possible orientations i1 → π−i1 and I → π−I are shown. Logarithmic scale of a number of solutions (NS) is shown in blue. The orange line indicates the maximal third body mass according to the limit of a third light from the LC solution. Red solid line indicates the stability limit according to Mardling & Aarseth (2001), dashed line indicates the stability limit according to Sterzik & Tokovinin (2002) and dot-dashed line according to Tokovinin (2004). The blue line shows restrictions on ETVs. All figures are plotted for the extremal third body eccentricities e2 = 0 and e2 = 0.5.
Current usage metrics show cumulative count of Article Views (full-text article views including HTML views, PDF and ePub downloads, according to the available data) and Abstracts Views on Vision4Press platform.
Data correspond to usage on the plateform after 2015. The current usage metrics is available 48-96 hours after online publication and is updated daily on week days.
Initial download of the metrics may take a while.