Fig. 9
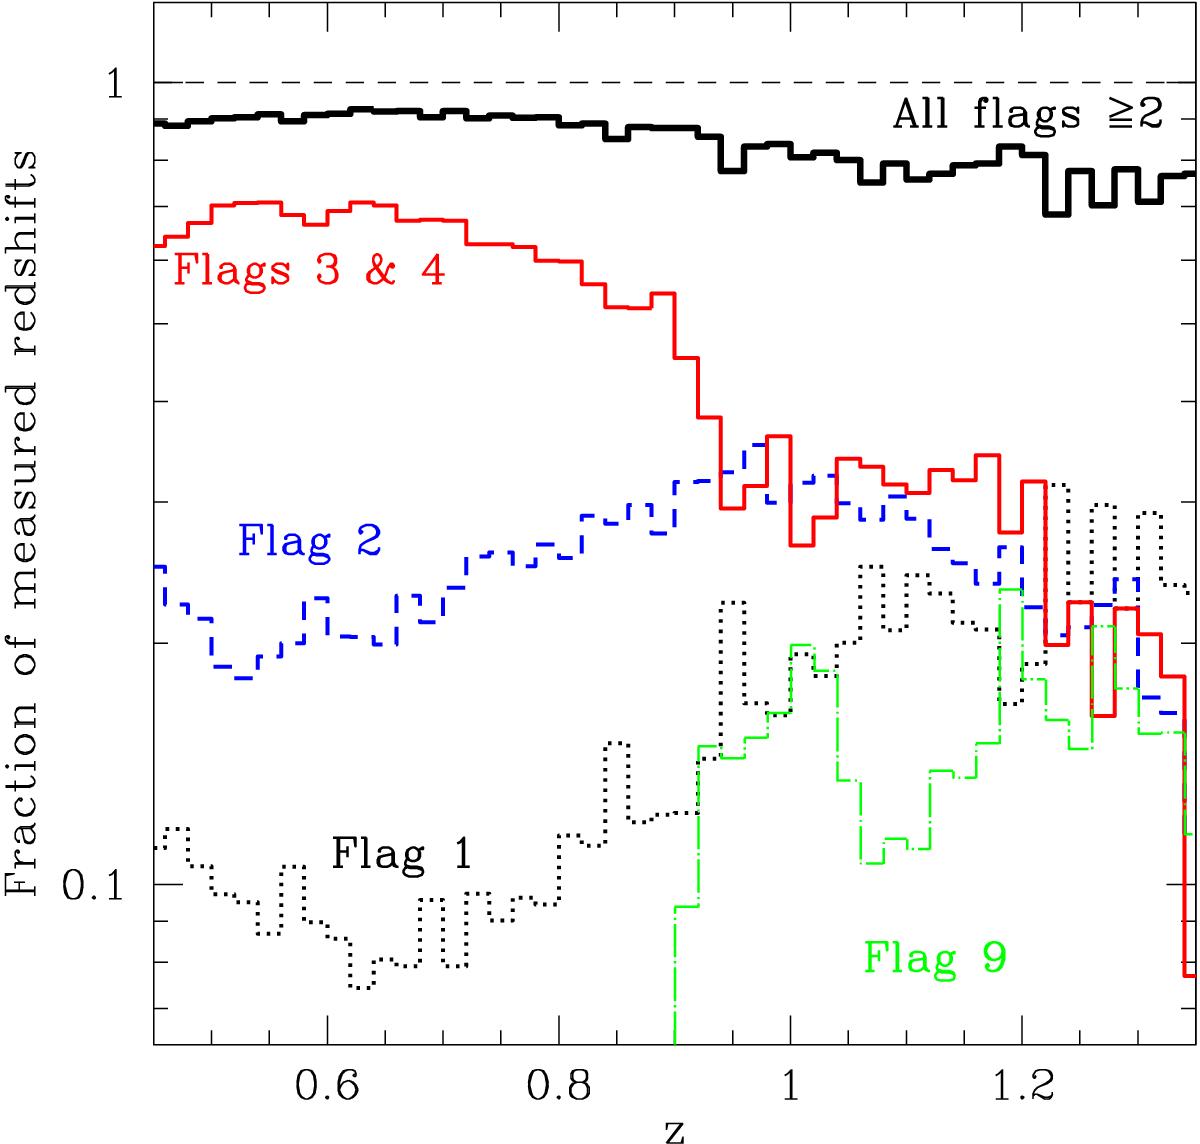
Quality of the VIPERS redshift measurements for different redshifts. Specifically, the plot shows how the fraction of measurements for different quality flags changes as a function of redshift. Note how the “reliable sample”, i.e. that with quality flag ≥ 2, to be used for statistical analyses, shows a stable measured fraction out to the limit of the survey.
Current usage metrics show cumulative count of Article Views (full-text article views including HTML views, PDF and ePub downloads, according to the available data) and Abstracts Views on Vision4Press platform.
Data correspond to usage on the plateform after 2015. The current usage metrics is available 48-96 hours after online publication and is updated daily on week days.
Initial download of the metrics may take a while.