Fig. 6
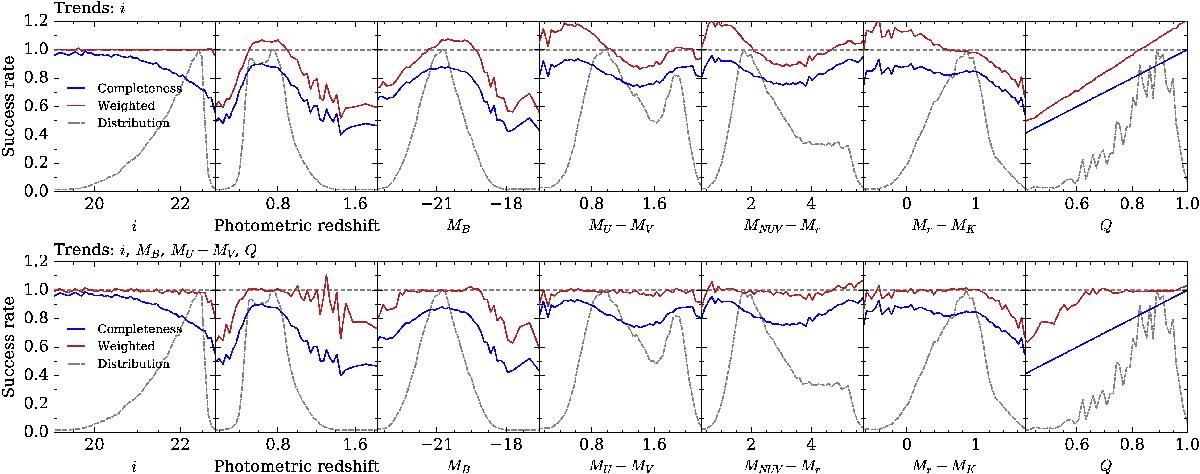
Spectroscopic success rate (SSR) as a function of different observed photometric properties (blue solid curve), compared to the result of applying the weight to correct incompleteness (red solid curve). The two rows of plots show how the completeness correction changes when one only considers a simple SSR dependence on the selection i-band magnitude (top), or rather includes the more subtle dependencies on observed colours and, in particular, quality of the specific VIMOS quadrant (“Q” parameter, quantified via the mean SSR for all galaxies in that quadrant). The differential distribution of each parameter is also plotted in each panel (dashed curve).
Current usage metrics show cumulative count of Article Views (full-text article views including HTML views, PDF and ePub downloads, according to the available data) and Abstracts Views on Vision4Press platform.
Data correspond to usage on the plateform after 2015. The current usage metrics is available 48-96 hours after online publication and is updated daily on week days.
Initial download of the metrics may take a while.