Fig. 5
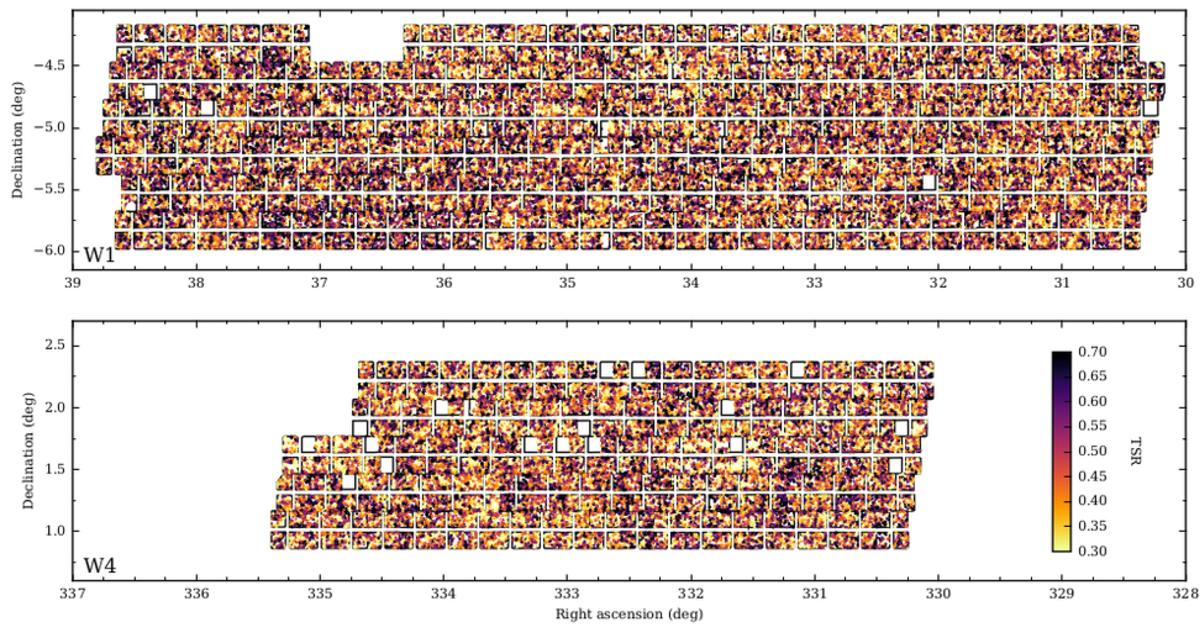
Angular distribution over the survey areas of the target sampling rate (TSR, colour scale), estimated locally for each galaxy as described in the text. In this plot, each value has been smoothed on a scale of 2 arcmin to enhance the (inverse) relationship of the TSR with the projected large-scale structure in the galaxy distribution.
Current usage metrics show cumulative count of Article Views (full-text article views including HTML views, PDF and ePub downloads, according to the available data) and Abstracts Views on Vision4Press platform.
Data correspond to usage on the plateform after 2015. The current usage metrics is available 48-96 hours after online publication and is updated daily on week days.
Initial download of the metrics may take a while.