Fig. 2
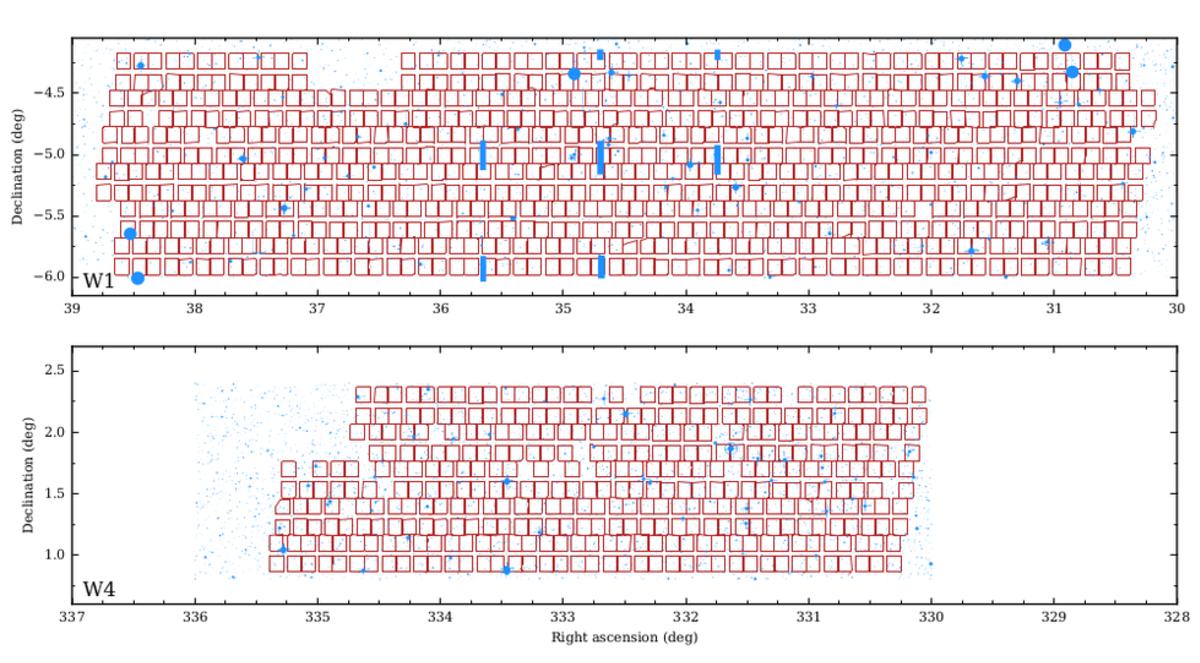
Layout on the sky of all pointings that contribute to the PDR-2 final release, for the two fields W1 and W4, superimposed on the photometric survey mask. The contours of each of the four quadrants that comprise all VIMOS pointings are shown in red. The blue (grey) areas in the background correspond to areas where the parent photometry is corrupted or observations are not possible due to the presence of foreground objects, particularly bright stars and their diffraction spikes. Note that in this plot failed quadrants and other features introduced by the “spectroscopic mask” are not indicated (see Sect. 3.2 and Figs. 3 and 5).
Current usage metrics show cumulative count of Article Views (full-text article views including HTML views, PDF and ePub downloads, according to the available data) and Abstracts Views on Vision4Press platform.
Data correspond to usage on the plateform after 2015. The current usage metrics is available 48-96 hours after online publication and is updated daily on week days.
Initial download of the metrics may take a while.