Fig. 14
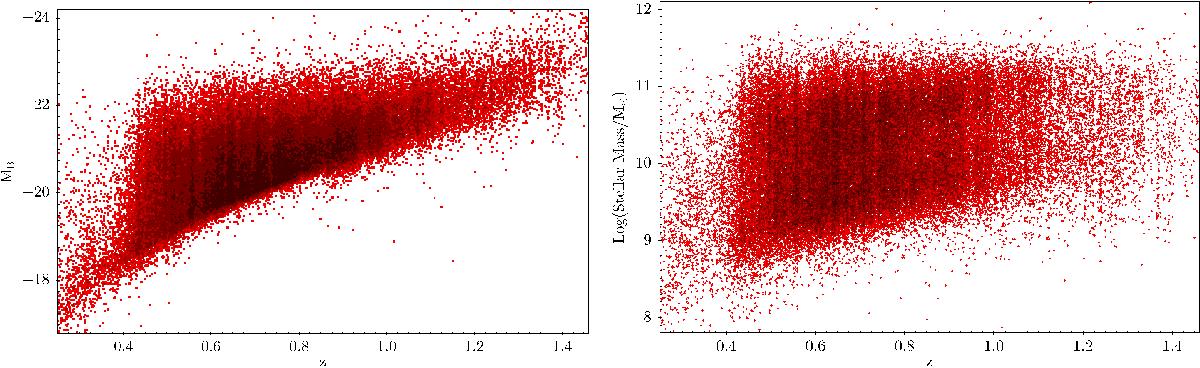
Distribution of B-band luminosities (left) and stellar masses (right) computed for all objects with reliable redshift (flag > 2.0) in the PDR-2 catalogue. These are estimated through SED fitting of all available photometry (from UV to K) as described in Moutard et al. (2016a). Note that an explicit value of H0 = 70 km s-1 Mpc-1 for the Hubble constant is used here.
Current usage metrics show cumulative count of Article Views (full-text article views including HTML views, PDF and ePub downloads, according to the available data) and Abstracts Views on Vision4Press platform.
Data correspond to usage on the plateform after 2015. The current usage metrics is available 48-96 hours after online publication and is updated daily on week days.
Initial download of the metrics may take a while.