Fig. 13
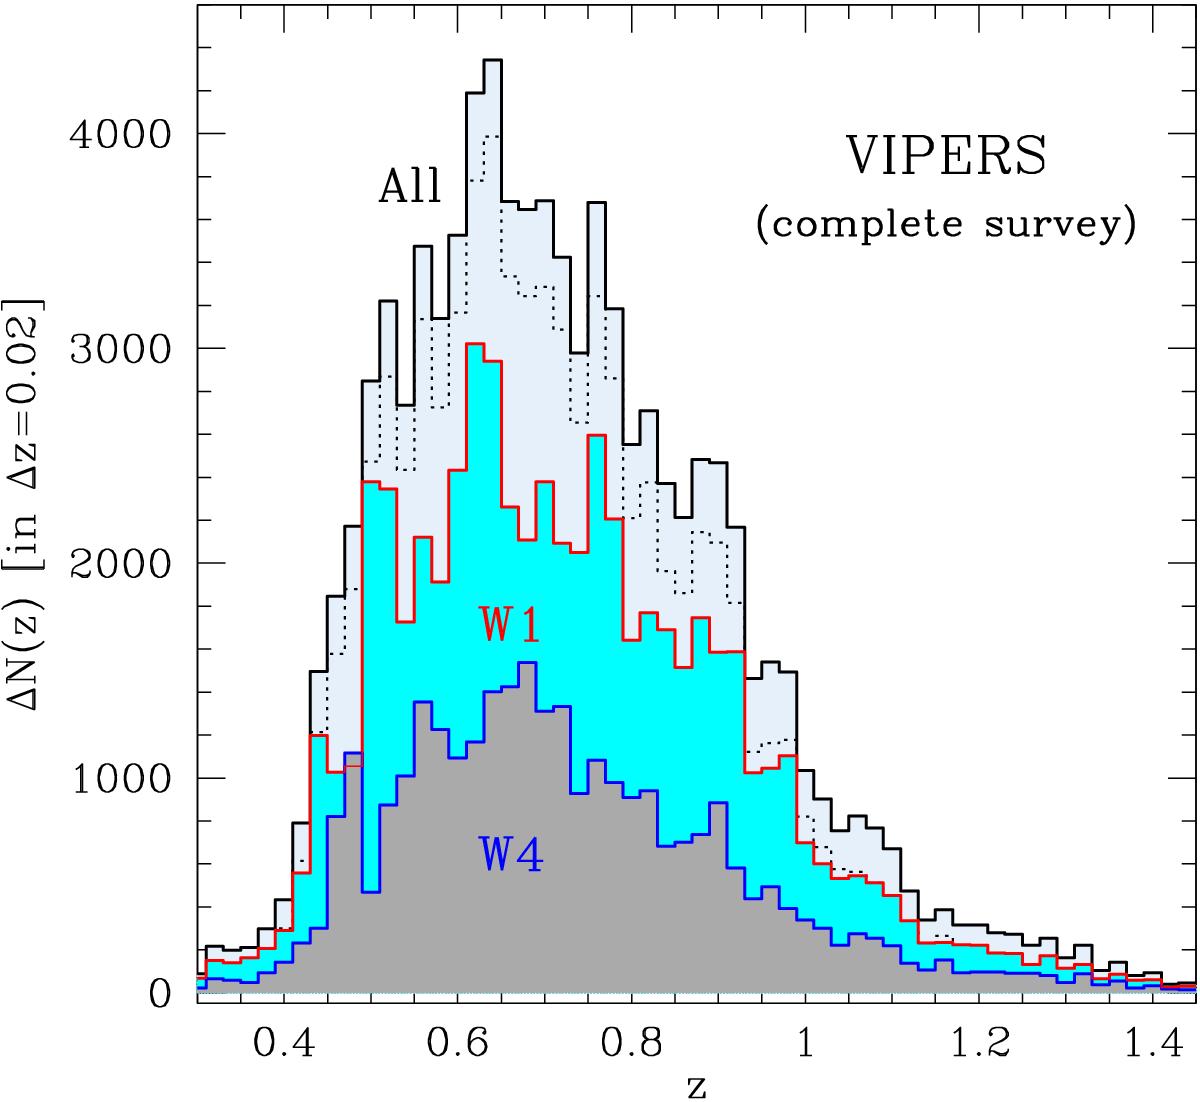
Galaxy redshift distribution in the final VIPERS PDR-2 catalogue (black solid line), and separately within the W1 and W4 fields (red and blue solid lines, respectively). These include all measured redshifts, with flag 1 or larger. The dotted line shows the result of plotting only the flag ≥ 2 galaxies, i.e. those that can be used reliably in statistical analyses.
Current usage metrics show cumulative count of Article Views (full-text article views including HTML views, PDF and ePub downloads, according to the available data) and Abstracts Views on Vision4Press platform.
Data correspond to usage on the plateform after 2015. The current usage metrics is available 48-96 hours after online publication and is updated daily on week days.
Initial download of the metrics may take a while.