Fig. 11
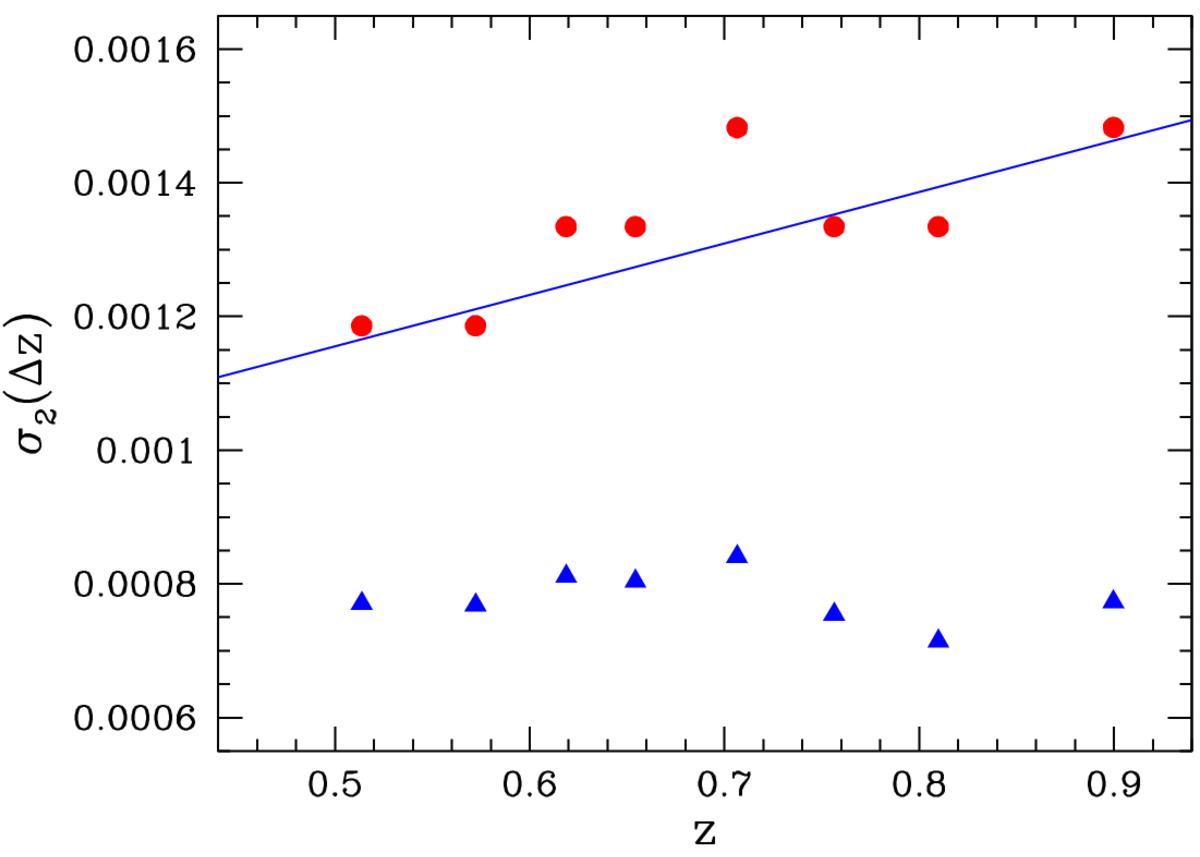
Scatter in the Δz values (red circles) and in the Δz/ (1 + z) values (blue triangles) for objects in a narrow redshift bin, as a function of the median redshift for the bin. The bins are built to contain a fixed number of objects (500), and they are not statistically independent since they partly overlap each other. The blue line shows the mean scatter derived from the blue points, with the (1 + z) scaling applied to it.
Current usage metrics show cumulative count of Article Views (full-text article views including HTML views, PDF and ePub downloads, according to the available data) and Abstracts Views on Vision4Press platform.
Data correspond to usage on the plateform after 2015. The current usage metrics is available 48-96 hours after online publication and is updated daily on week days.
Initial download of the metrics may take a while.