Fig. 8
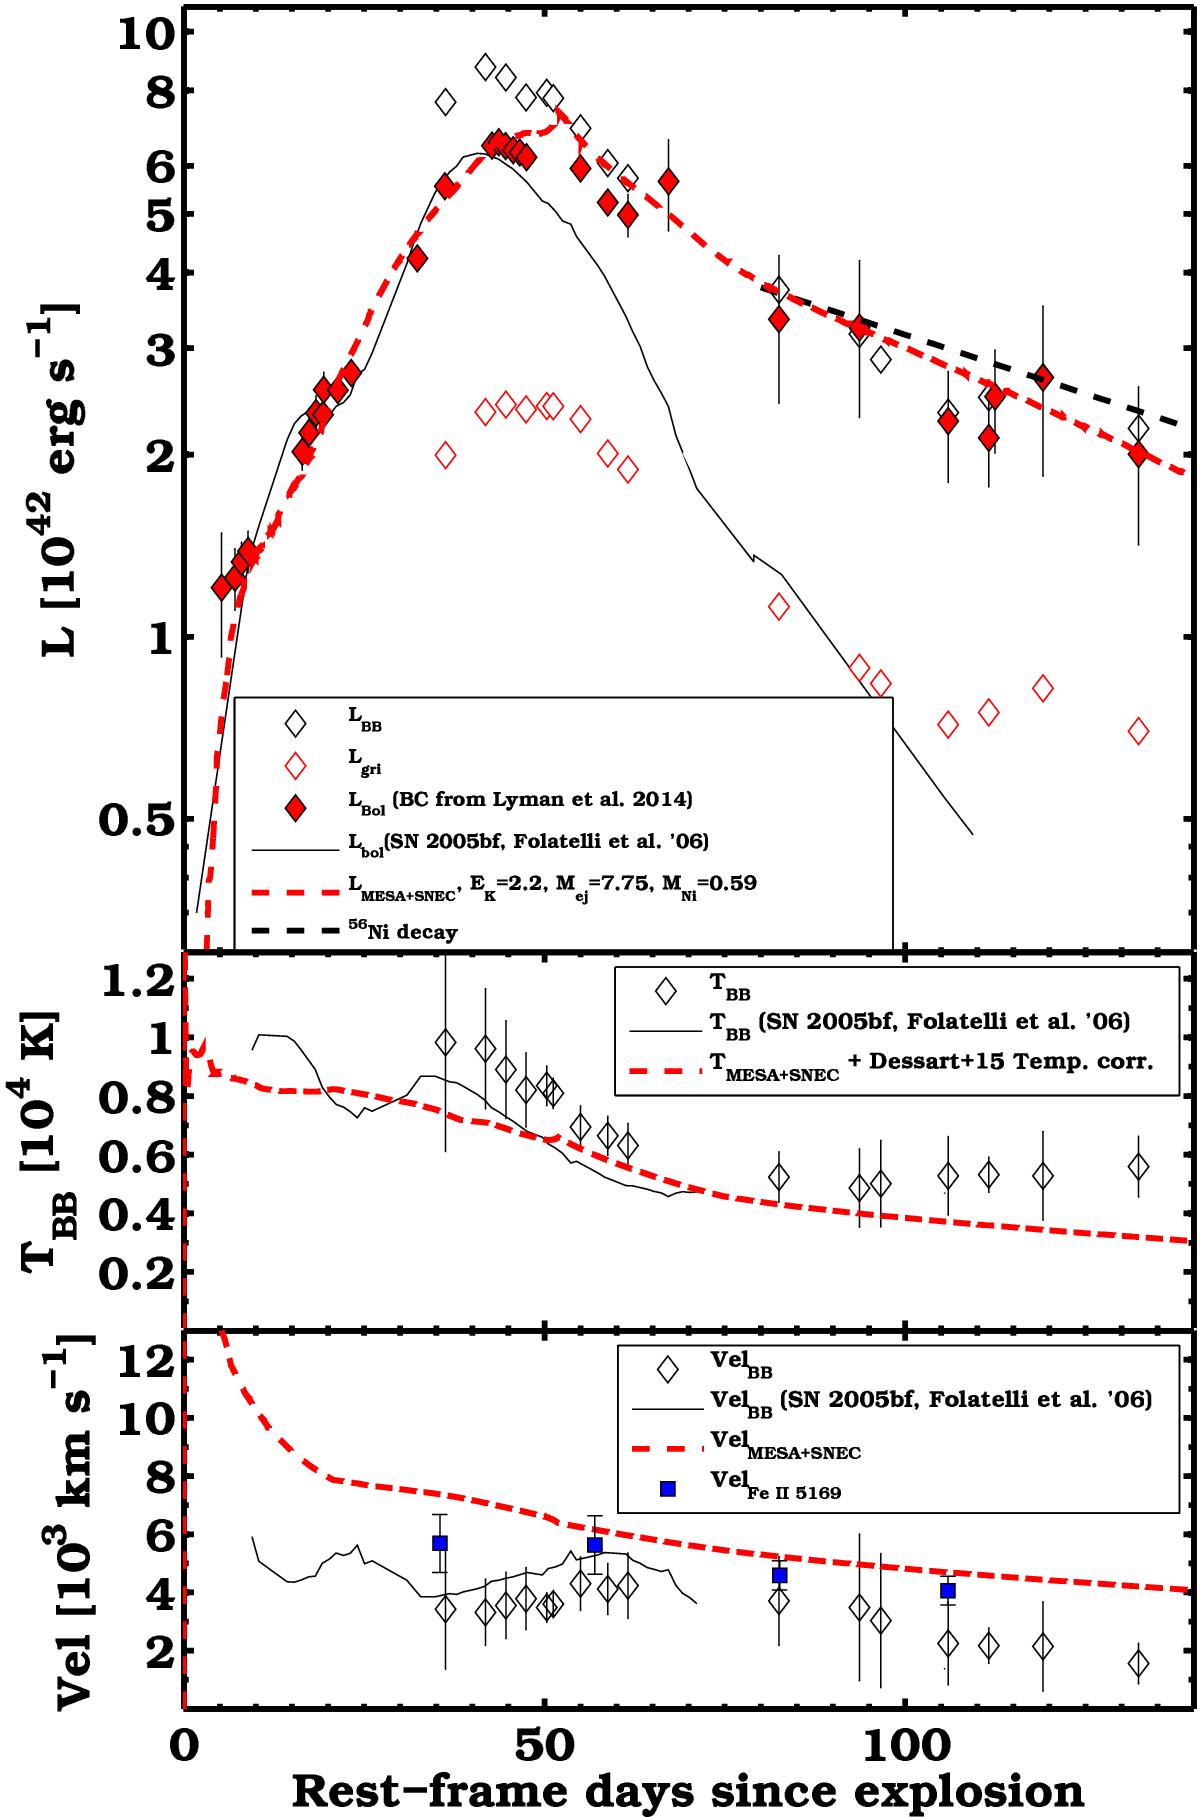
Top panel: bolometric light curve of PTF11mnb. The luminosity from the integrated gri SEDs, from the BB fit to the SED, and from g and r along with the bolometric corrections by Lyman et al. (2014) are indicated with empty red diamonds, empty black diamonds, and red diamonds, respectively. The light curve of SN 2005bf from Folatelli et al. (2006) is plotted as a black solid line. The luminosity from the 56Co decay (M [ 56Ni] = 0.59 M⊙) is indicated with a black dashed line. The preferred hydrodynamical model is shown as a red dashed line. Central panel: BB temperature evolution of PTF11mnb (black diamonds) is compared to that of SN 2005bf from Folatelli et al. (2006) and that of the preferred hydrodynamical model (red dashed line). Bottom panel: BB velocity evolution of PTF11mnb (black diamonds) is compared to that of SN 2005bf from Folatelli et al. (2006), to the photospheric velocity of the preferred hydrodynamical model (red dashed line), and to the Fe ii P-Cygni absorption velocity of PTF11mnb (blue squares).
Current usage metrics show cumulative count of Article Views (full-text article views including HTML views, PDF and ePub downloads, according to the available data) and Abstracts Views on Vision4Press platform.
Data correspond to usage on the plateform after 2015. The current usage metrics is available 48-96 hours after online publication and is updated daily on week days.
Initial download of the metrics may take a while.