Free Access
Fig. 7
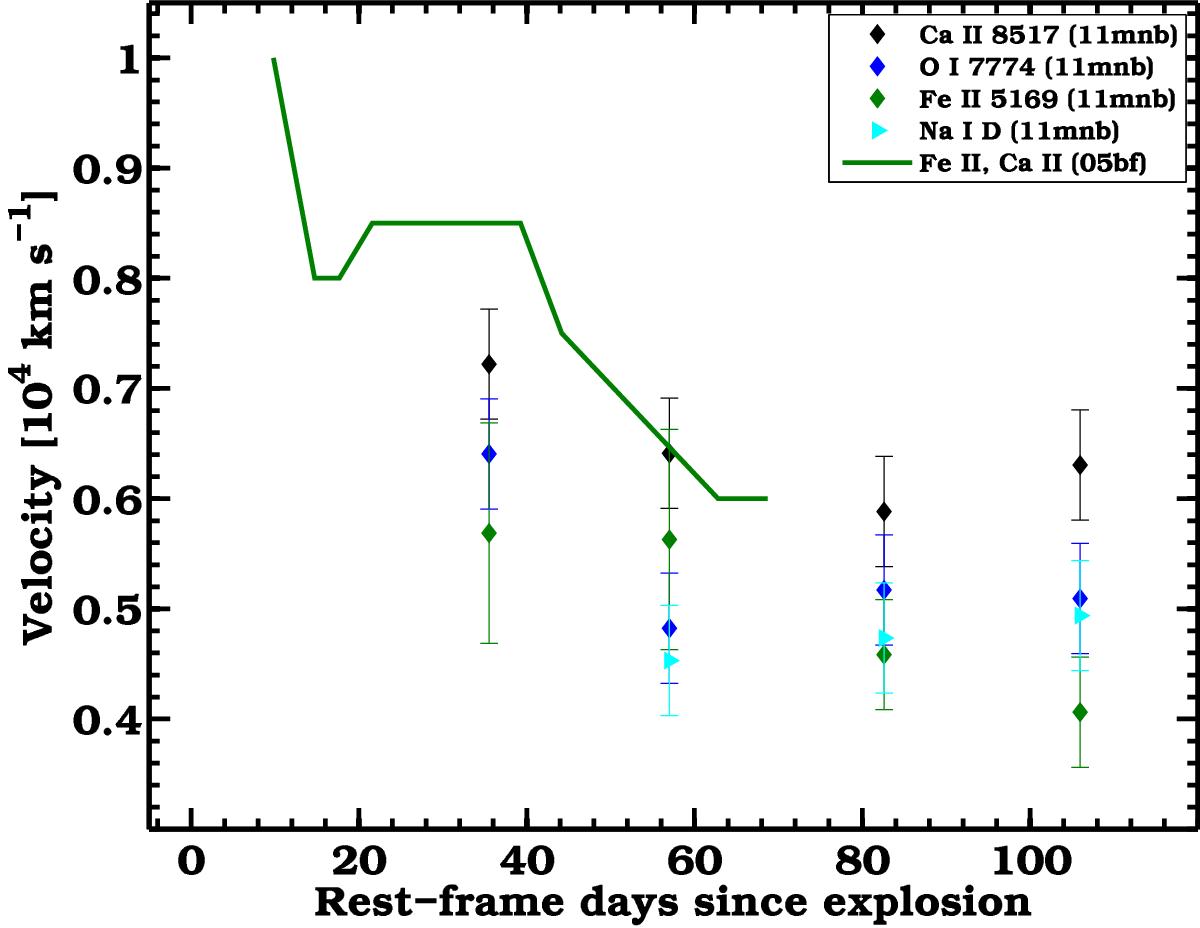
Expansion velocities of PTF11mnb as measured from the absorption minima of some spectral lines showing P-Cygni profiles. We also report the Fe ii and Ca ii velocities of SN 2005bf for comparison. SN 2005bf also shows high and low velocity components for these lines, as shown by Folatelli et al. (2006).
Current usage metrics show cumulative count of Article Views (full-text article views including HTML views, PDF and ePub downloads, according to the available data) and Abstracts Views on Vision4Press platform.
Data correspond to usage on the plateform after 2015. The current usage metrics is available 48-96 hours after online publication and is updated daily on week days.
Initial download of the metrics may take a while.