Fig. 6
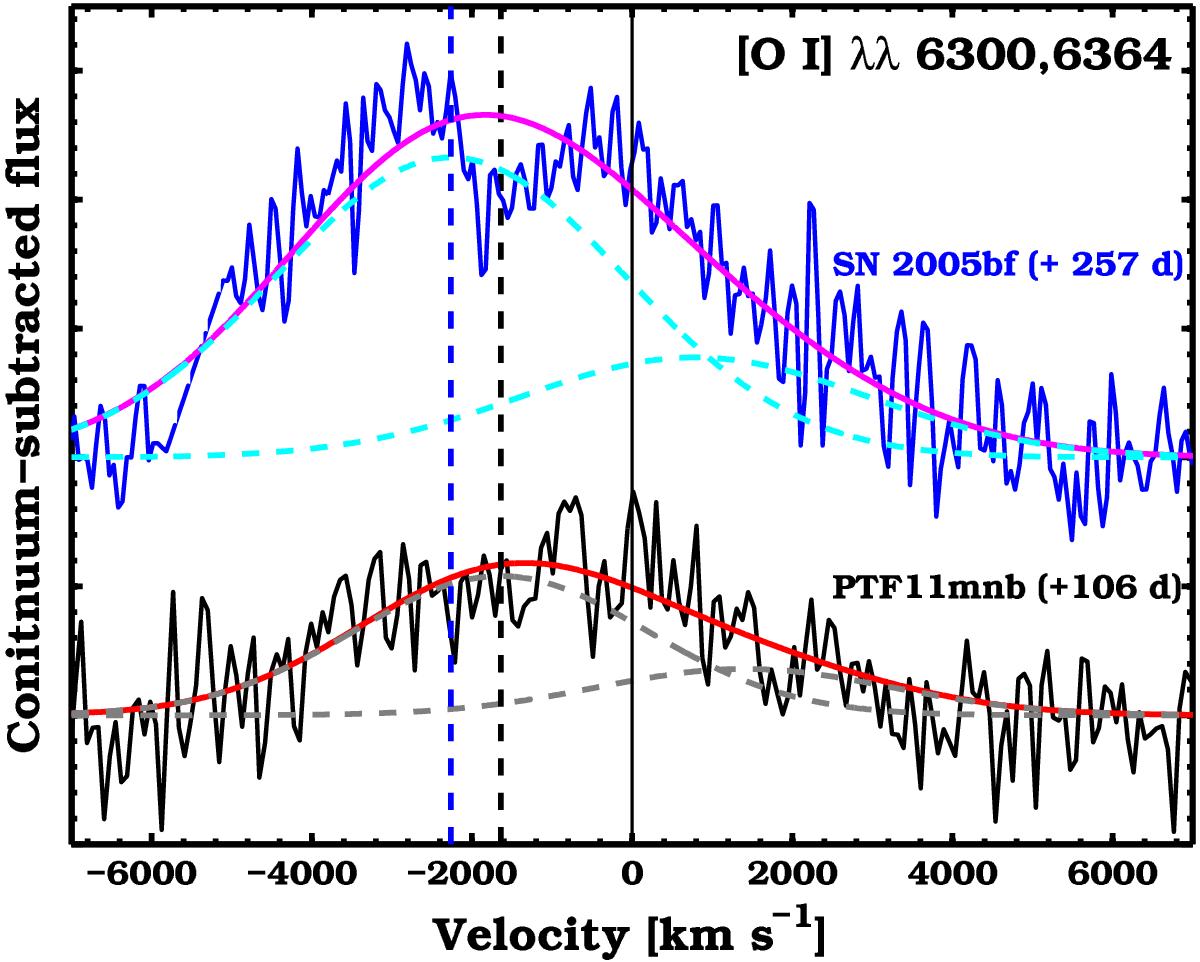
[O i] λλ6300, 6364 lines from the fourth spectrum of PTF11mnb (+106 d, black line) as compared to the same lines in a late spectrum of SN 2005bf (from Modjaz et al. 2008, blue line). The [O i] λλ6300, 6364 lines are shown in velocity space and continuum subtracted, after fitting the continuum with a low order polynomial. The lines are fitted with the sum (solid curves) of two Gaussians (shown as dashed curved), with the same FWHM, relative flux ratio of 1:3, and peaks separated by 64 Å. The [O i] λ6300 line peaks are indicated with thick dashed lines, at −1640 km s-1 for PTF11mnb and −2260 km s-1 for SN 2005bf. The zero velocity of the line (at 6300 Å) is indicated with a solid, vertical black line.
Current usage metrics show cumulative count of Article Views (full-text article views including HTML views, PDF and ePub downloads, according to the available data) and Abstracts Views on Vision4Press platform.
Data correspond to usage on the plateform after 2015. The current usage metrics is available 48-96 hours after online publication and is updated daily on week days.
Initial download of the metrics may take a while.