Fig. 5
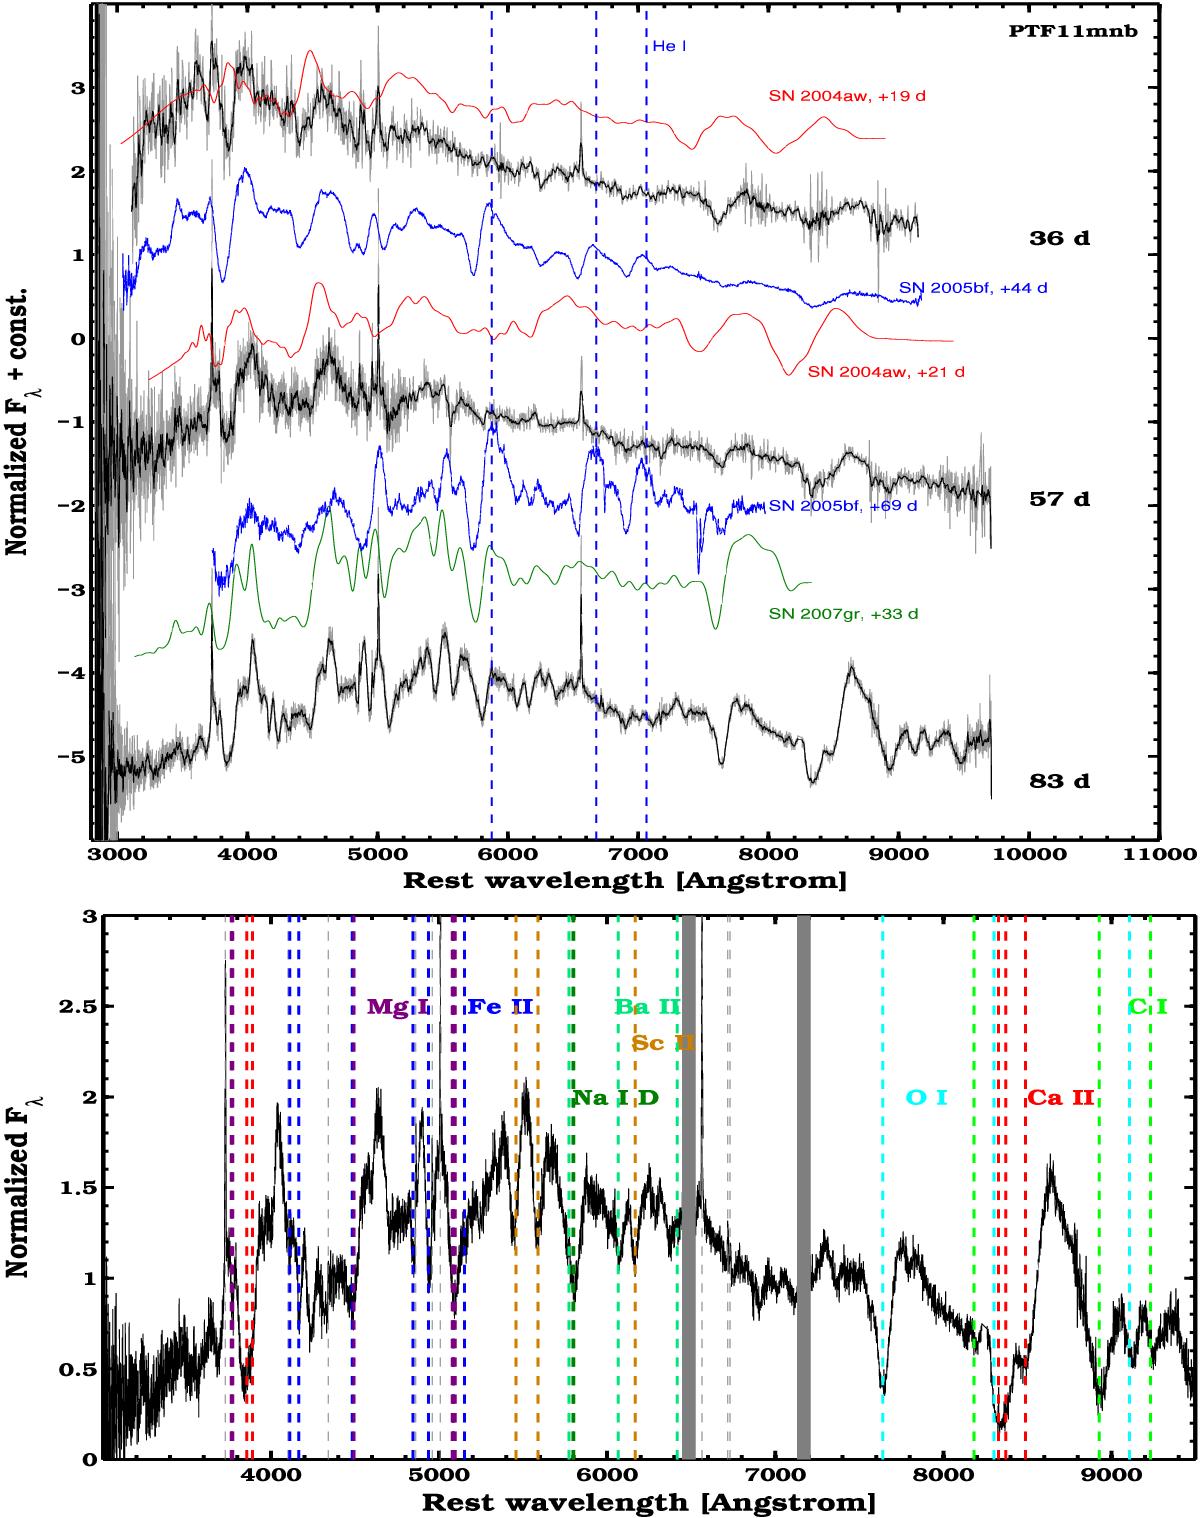
Top panel: spectral comparison of PTF11mnb to other SNe Ic (from SNID templates, Blondin & Tonry 2007; Liu & Modjaz 2014) and SN 2005bf (Folatelli et al. 2006). Phases from explosion in rest-frame days are reported next to each spectrum. SN 2005bf is the only SN showing strong He lines, which are not present in PTF11mnb. Bottom panel: line identification on the best PTF11mnb spectrum. Typical SN Ic features dominate the spectrum, with ions such as Ca ii, O i, Fe ii, Mg i, C i, and Na i. Lines from ions such as Sc ii and Ba ii are also visible. Dashed lines of the same color indicate the same ion, which is labeled in the plot with the same color. Gray areas represent the most prominent telluric features.
Current usage metrics show cumulative count of Article Views (full-text article views including HTML views, PDF and ePub downloads, according to the available data) and Abstracts Views on Vision4Press platform.
Data correspond to usage on the plateform after 2015. The current usage metrics is available 48-96 hours after online publication and is updated daily on week days.
Initial download of the metrics may take a while.