Free Access
Fig. 4
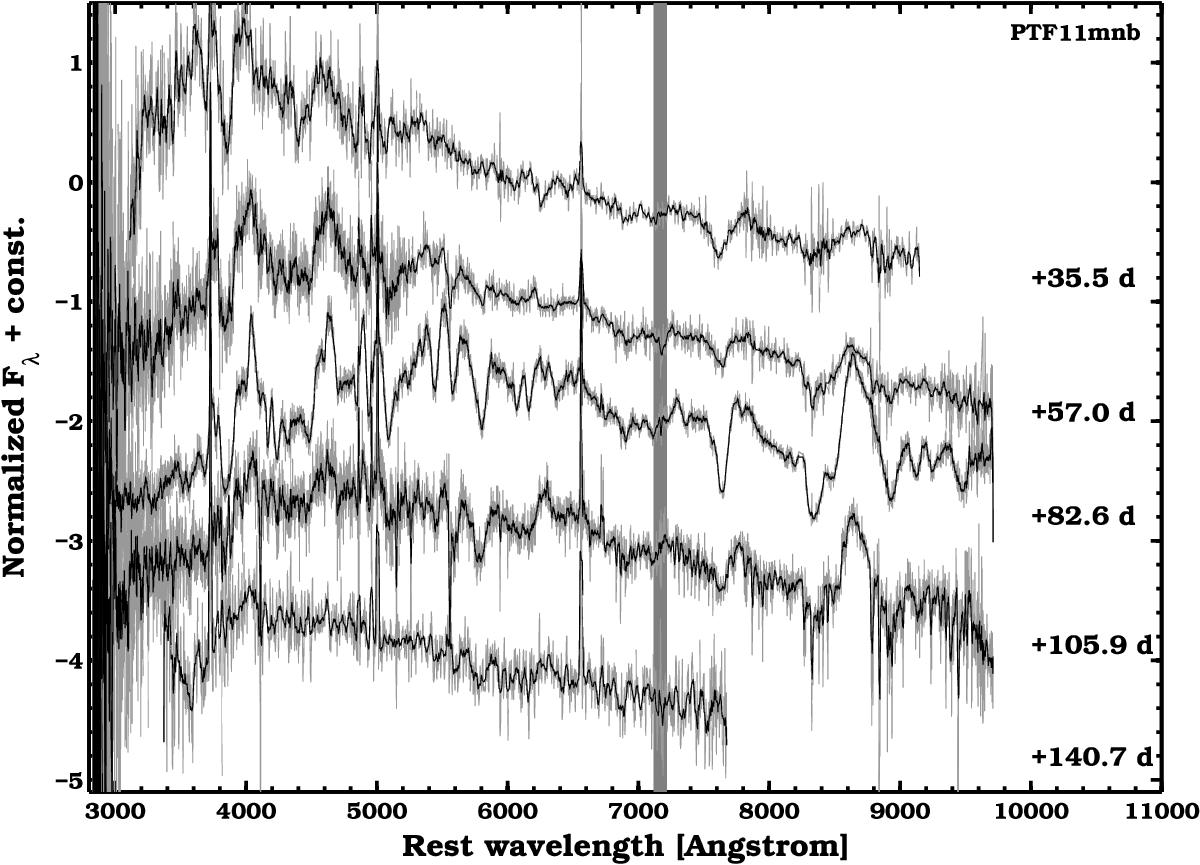
Spectral sequence of PTF11mnb. Phases in rest-frame days since explosion are reported next to each spectrum. A gray area masks the strongest telluric feature at 7600 Å.
Current usage metrics show cumulative count of Article Views (full-text article views including HTML views, PDF and ePub downloads, according to the available data) and Abstracts Views on Vision4Press platform.
Data correspond to usage on the plateform after 2015. The current usage metrics is available 48-96 hours after online publication and is updated daily on week days.
Initial download of the metrics may take a while.