Fig. 3
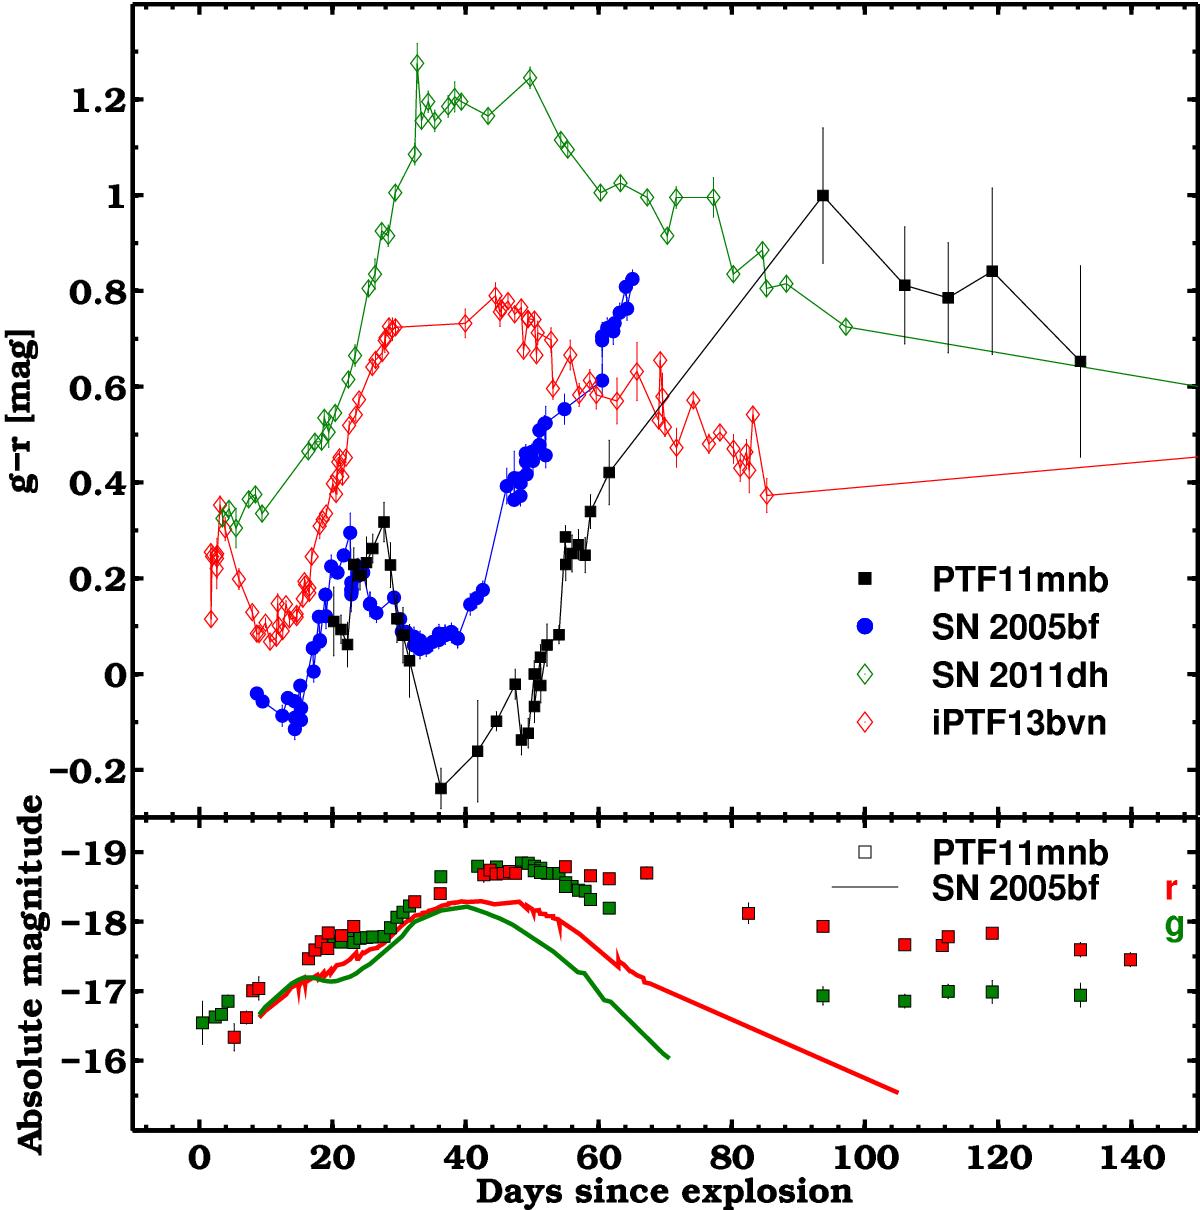
Top panel: color comparison of g−r between PTF11mnb, SN 2005bf, SN Ib iPTF13bvn (Fremling et al. 2016), and SN IIb 2011dh (Ergon et al. 2014, 2015). The first two SNe reach a red peak in the color, which coincides with the early peak in their light curves (see bottom panel). Then their g−r becomes bluer reaching a minimum when the main peak of the light curves occurs. Thereafter, they rapidly evolve to redder colors. PTF11mnb also shows a shallow trend to the blue after ~100 d, when the light curves are flatter (see bottom panel) and when SN 2005bf was not observed. iPTf13bvn and SN 2011dh evolve very differently, reaching a g−r minimum at peak magnitude, followed by a linear trend to the red and a final flatter color after ~30 d. Bottom panel: absolute g- and r-band light curves of PTF11mnb and SN 2005bf, plotted as a reference for the various phases of the color evolution.
Current usage metrics show cumulative count of Article Views (full-text article views including HTML views, PDF and ePub downloads, according to the available data) and Abstracts Views on Vision4Press platform.
Data correspond to usage on the plateform after 2015. The current usage metrics is available 48-96 hours after online publication and is updated daily on week days.
Initial download of the metrics may take a while.