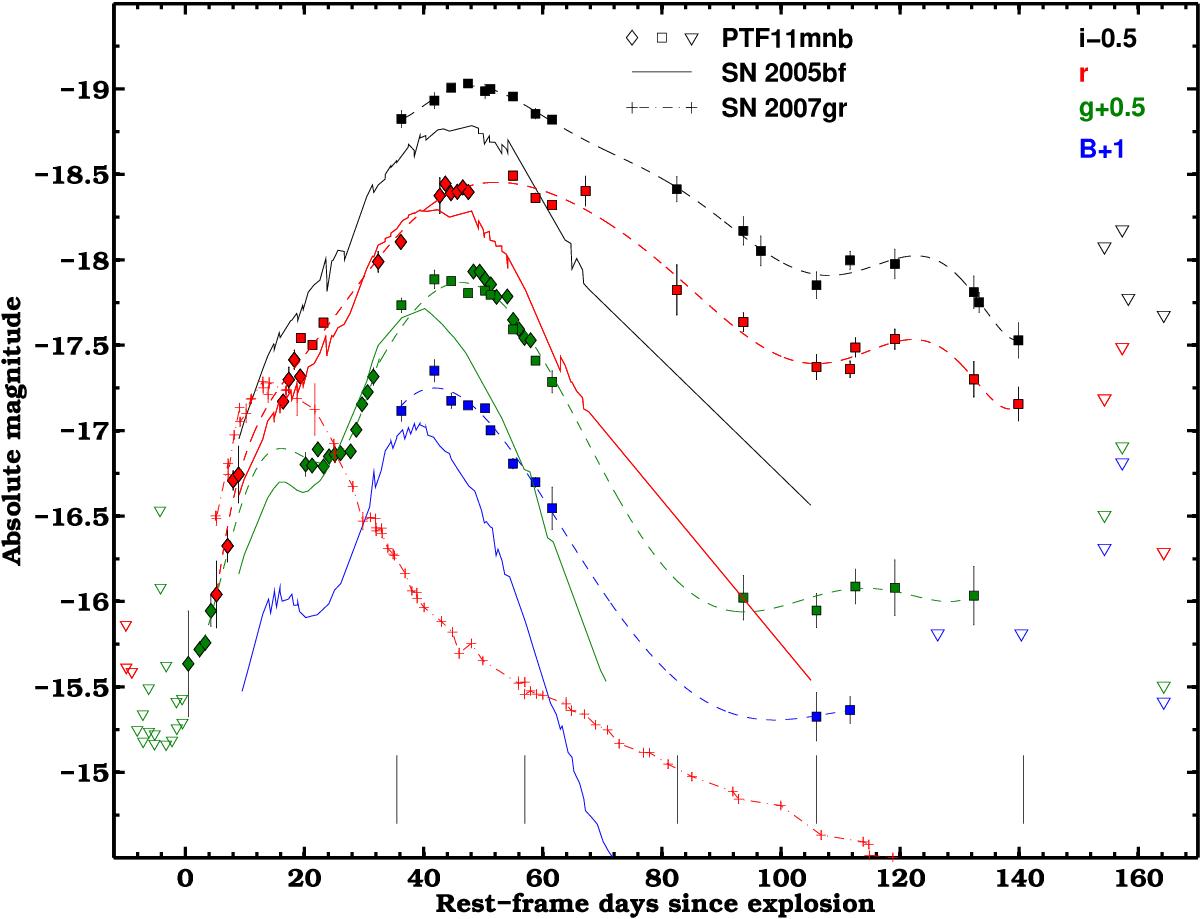
Fig. 2

Optical (Bgri) light curves of supernova PTF11mnb (colored symbols) compared to those of SN 2005bf (solid lines; Folatelli et al. 2006; Bianco et al. 2014). The light curves of both events have been shifted in the same way, as indicated in the top-right corner. The five spectral epochs for PTF11mnb are indicated with vertical black segments at the bottom of the plot. The light curves of PTF11mnb were fit with low-order polynomials (dashed lines) to characterize their shape. Limiting magnitudes are indicated with empty triangles. P48 data are indicated with diamonds, P60 data by squares. Until and including the main peak, the light curves of SN 2005bf and PTF11mnb resemble each other, whereas after the main peak, PTF11mnb, shows a much slower decline rate. We also compare the r-band light curves of PTF11mnb and SN 2005bf to the R-band light curve of the normal SN Ic 2007gr (Hunter et al. 2009). While the first two SNe show the main peak at ~52/42 d and at −18.5/−18.3 mag, SN 2007gr peaks at a similar phase (at ~16 d) and magnitude (~−17.2 mag) as the early peak/bump of the other two events.
Current usage metrics show cumulative count of Article Views (full-text article views including HTML views, PDF and ePub downloads, according to the available data) and Abstracts Views on Vision4Press platform.
Data correspond to usage on the plateform after 2015. The current usage metrics is available 48-96 hours after online publication and is updated daily on week days.
Initial download of the metrics may take a while.


