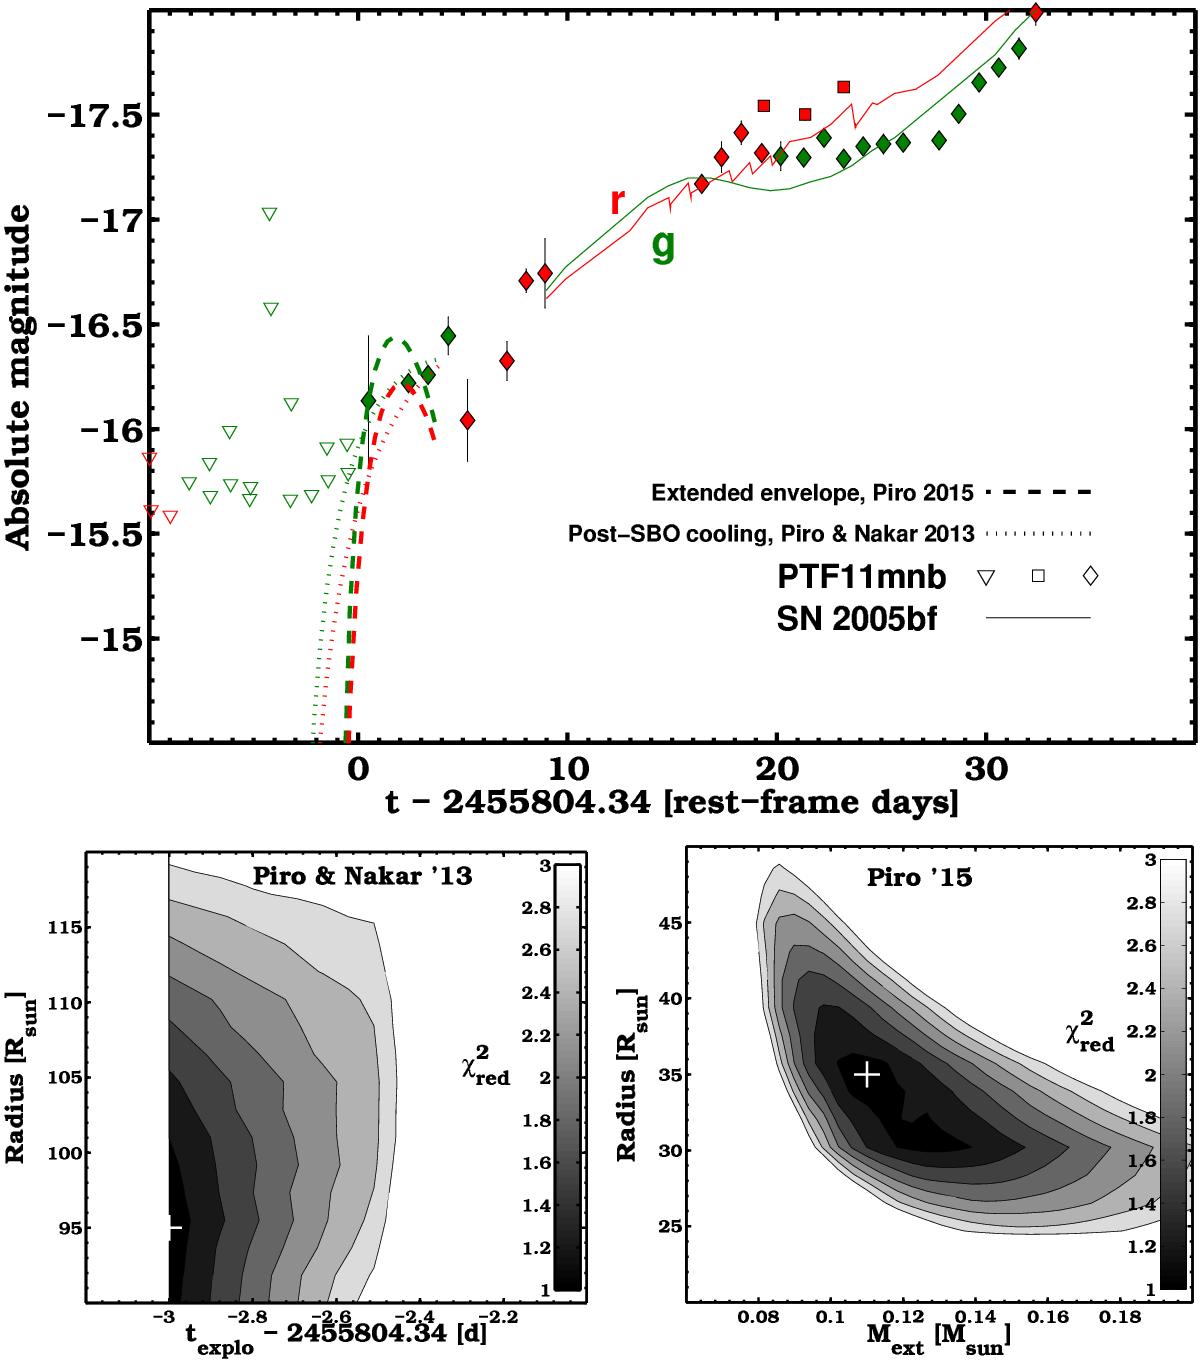
Fig. 12

Top panel: early g- and r-band light curves of PTF11mnb as compared to those of SN 2005bf. Squares and diamonds indicate P60 and P48 data, respectively. Triangles indicate upper limits. PTF11mnb was discovered earlier and does not show a regular rising light curve in the first 3 epochs of g-band data. We fit these epochs with a shock breakout (SBO) cooling tail model from Piro & Nakar (2013) and with an extended envelope model from Piro (2015). The best fit of the latter model reveals the likely presence of a relatively extended envelope around the progenitor star (~35 R⊙). Bottom panels: reduced chi square for the two g-band light curve fits; Piro & Nakar (2013) fits are shown on the left and Piro (2015) fits are shown. When fitting the model by Piro & Nakar (2013) we solved for the explosion epoch andprogenitor radius. When fitting the model provided by Piro (2015) we solved for the extended envelope radius and mass; the explosion epoch was fixed to −1 d since the previously assumed value.
Current usage metrics show cumulative count of Article Views (full-text article views including HTML views, PDF and ePub downloads, according to the available data) and Abstracts Views on Vision4Press platform.
Data correspond to usage on the plateform after 2015. The current usage metrics is available 48-96 hours after online publication and is updated daily on week days.
Initial download of the metrics may take a while.


