Fig. 11
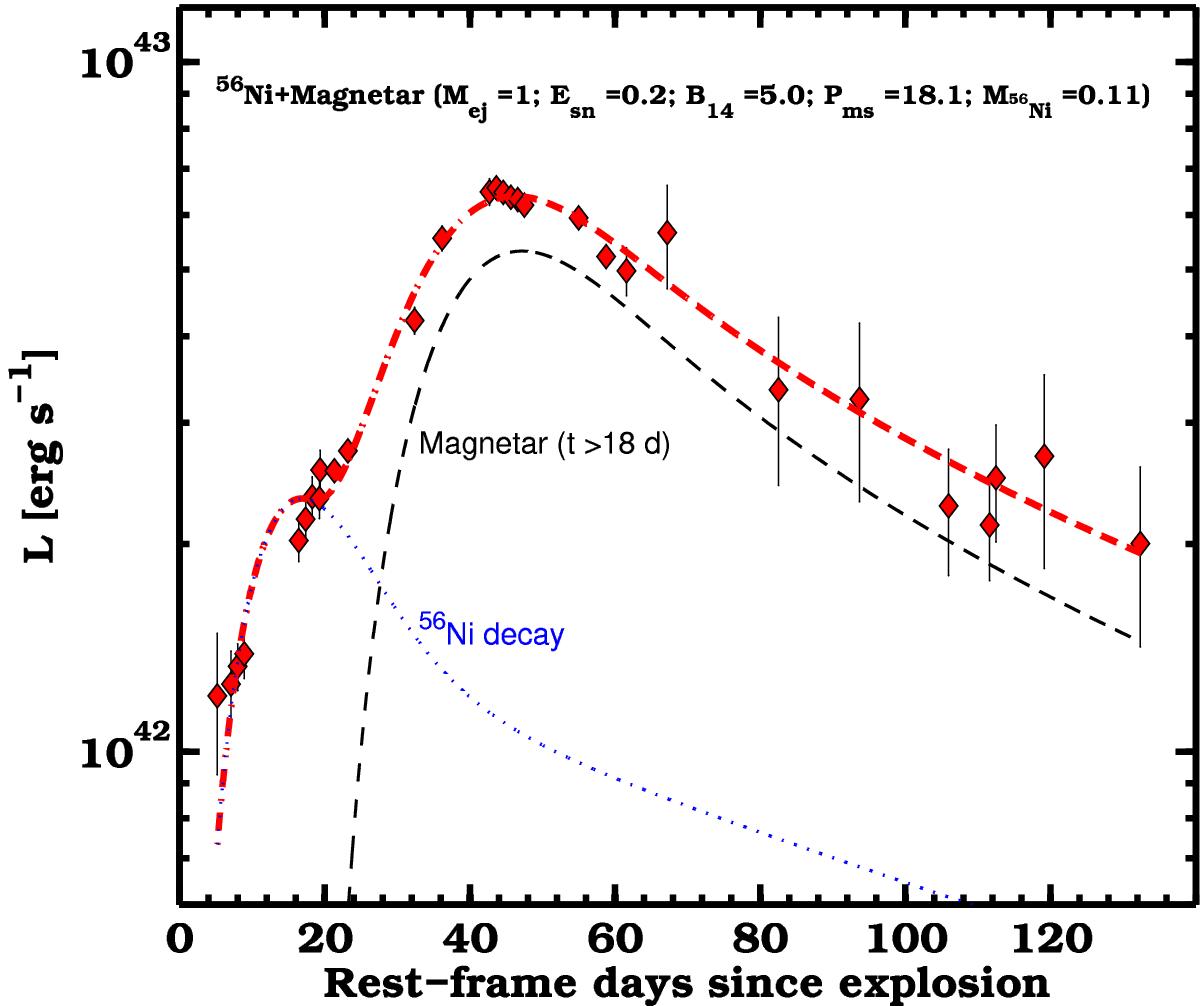
Hybrid bolometric light-curve model (red dashed line) of PTF11mnb. The first peak is fit by the radioactive decay of 56Ni and represented by an Arnett model (blue dotted line). The main peak is powered by a magnetar model (dashed black line) from Kasen & Bildsten (2010), which kicks in 18 days after explosion. The best fit parameters are reported at the top of the plot.
Current usage metrics show cumulative count of Article Views (full-text article views including HTML views, PDF and ePub downloads, according to the available data) and Abstracts Views on Vision4Press platform.
Data correspond to usage on the plateform after 2015. The current usage metrics is available 48-96 hours after online publication and is updated daily on week days.
Initial download of the metrics may take a while.