Fig. 4
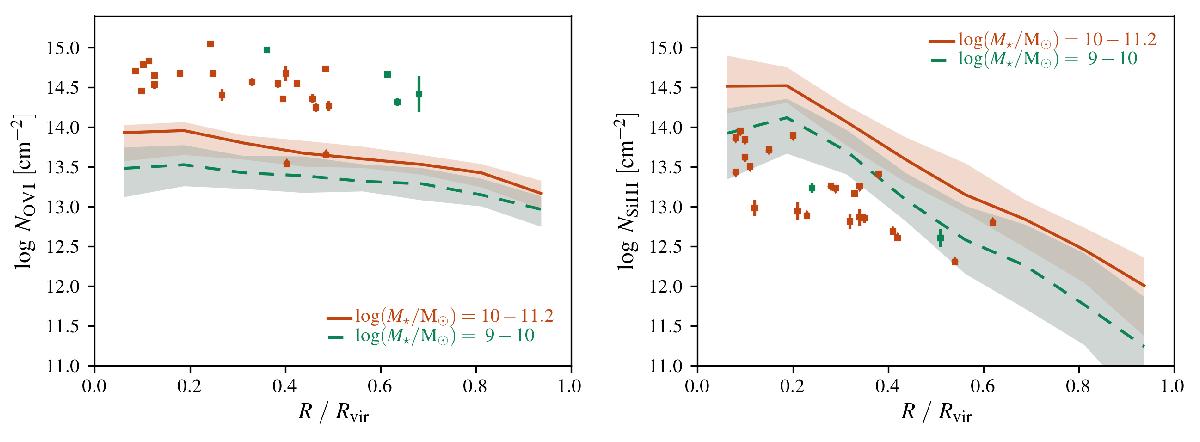
Median profiles of O vi (left) and Si iii (right) column density for S230D. The lines show the median values for two mass ranges, and the shaded areas encompass the 16th to 84th percentile range. The points are the observed column densities given by Tumlinson et al. (2011, 2013) for the O vi and by Werk et al. (2014) for the Si iii. In the observational data only star-forming galaxies are included.
Current usage metrics show cumulative count of Article Views (full-text article views including HTML views, PDF and ePub downloads, according to the available data) and Abstracts Views on Vision4Press platform.
Data correspond to usage on the plateform after 2015. The current usage metrics is available 48-96 hours after online publication and is updated daily on week days.
Initial download of the metrics may take a while.