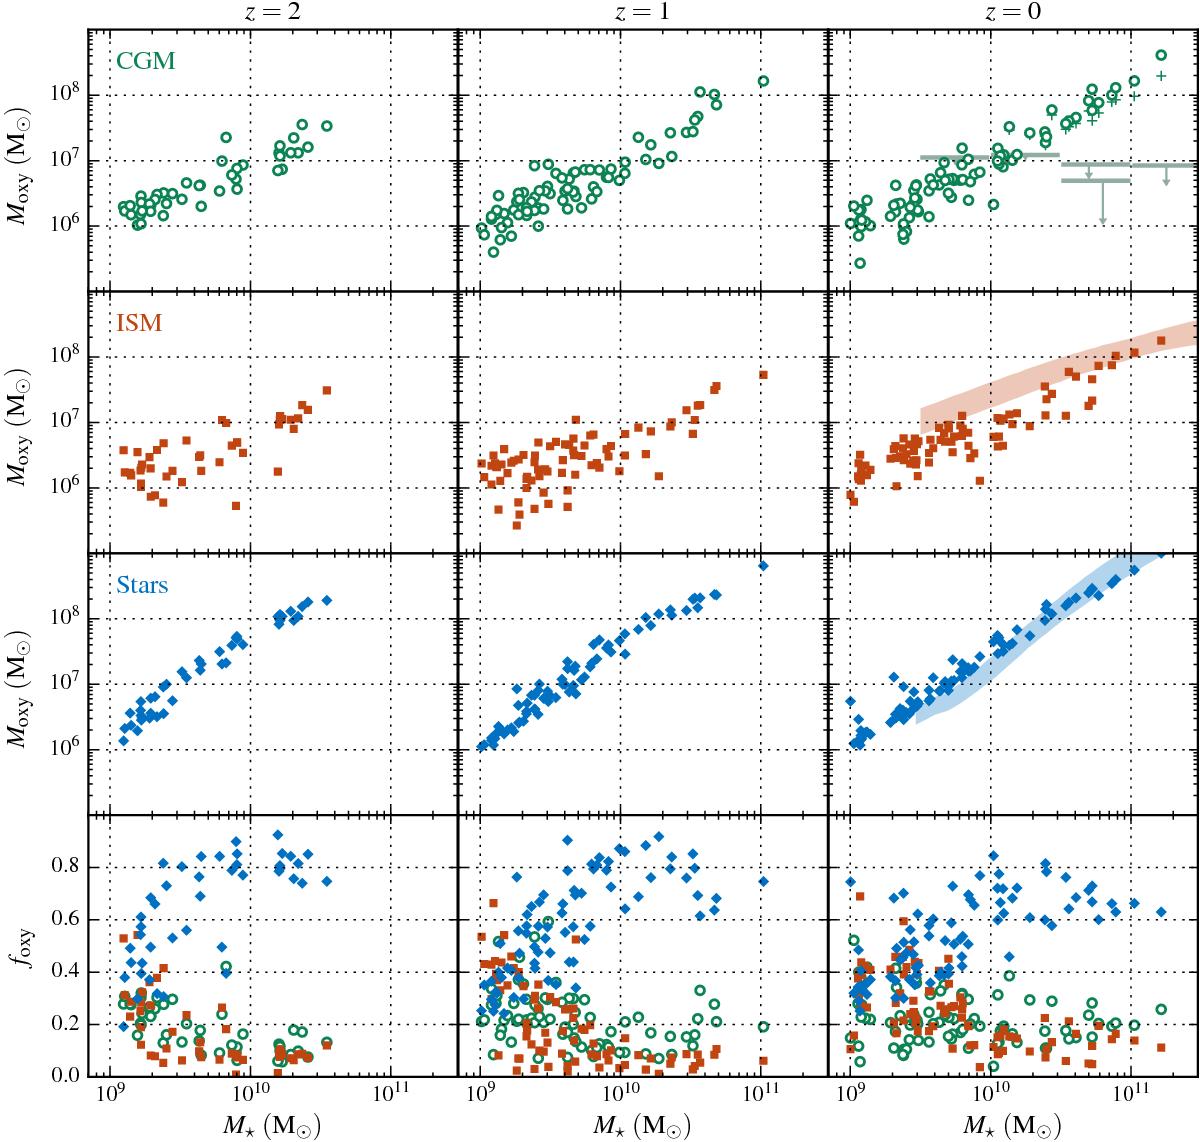
Fig. 3
Masses of oxygen in the CGM (circles), in the ISM (squares) and in stars (diamonds) as a function of stellar mass, at redshifts z = 2,1 and 0 (from left to right) for S230D. The observational lower limits of CGM oxygen at z = 0 are taken from Tumlinson et al. (2011). The shaded areas for ISM and stars at z = 0 represent the ranges of observational estimates from Peeples et al. (2014). The bottom row shows the contribution in each component (CGM, ISM and stars) to the total oxygen mass. In the uppermost right-hand panel, the small crosses represent the estimation of oxygen mass within 150 kpc (shown only for the largest galaxies).
Current usage metrics show cumulative count of Article Views (full-text article views including HTML views, PDF and ePub downloads, according to the available data) and Abstracts Views on Vision4Press platform.
Data correspond to usage on the plateform after 2015. The current usage metrics is available 48-96 hours after online publication and is updated daily on week days.
Initial download of the metrics may take a while.