Free Access
Fig. 13
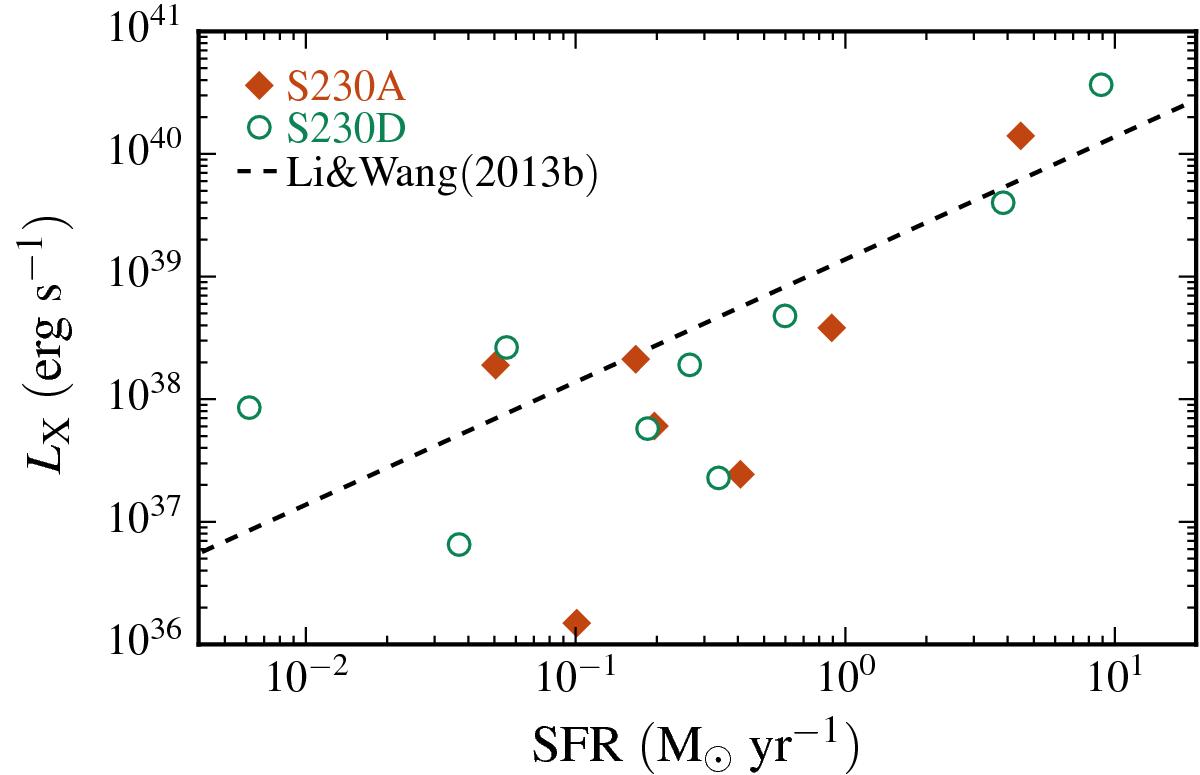
X-ray luminosities (0.5–2 keV) as a function of star formation rate, for the most massive galaxies of simulation S230A and S230D, at redshift z = 0. The dashed line is the observational correlation from Li & Wang (2013b).
Current usage metrics show cumulative count of Article Views (full-text article views including HTML views, PDF and ePub downloads, according to the available data) and Abstracts Views on Vision4Press platform.
Data correspond to usage on the plateform after 2015. The current usage metrics is available 48-96 hours after online publication and is updated daily on week days.
Initial download of the metrics may take a while.