Fig. 11
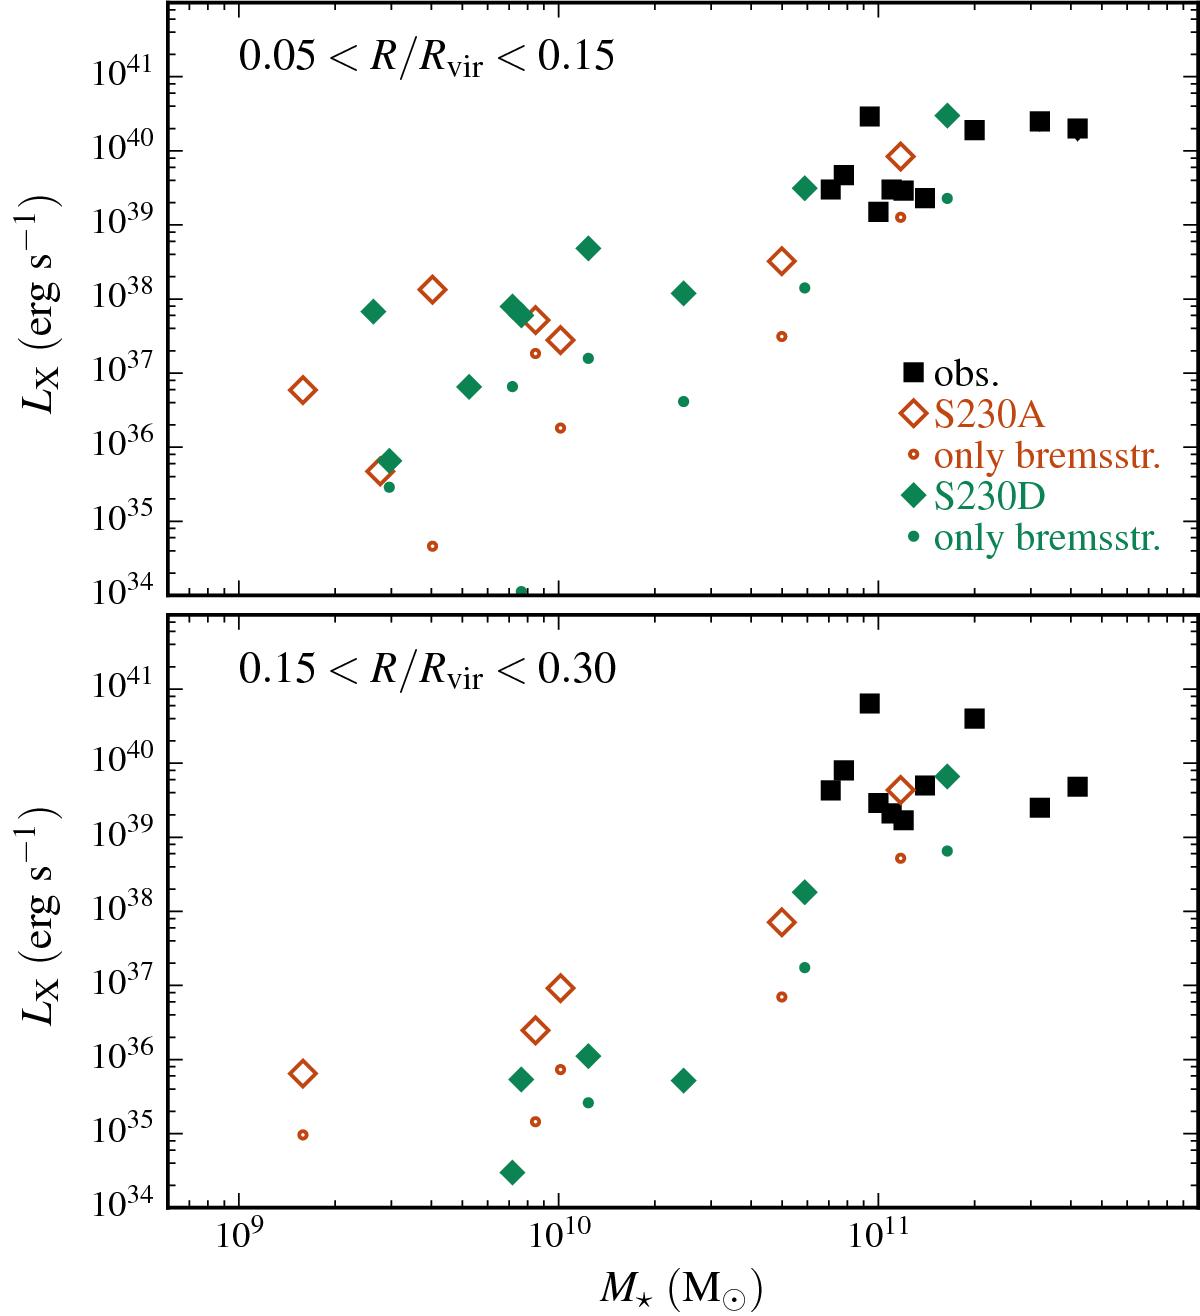
Simulated X-ray luminosities (0.5–2 keV) as a function of stellar mass for the most massive galaxies of simulation S230A and their counterparts in S230D, at redshift z = 0. The diamonds represent luminosities from the simulation, including metal cooling. The squares are the upper-limit observational estimates from Bogdán et al. (2015) in the same energy range. The luminosities (both observed and simulated) were measured within two regions: an inner annulus (upper frame) and an outer annulus (lower frame). For comparison, the small circles show the simulation estimates taking into account only the bremsstrahlung contribution.
Current usage metrics show cumulative count of Article Views (full-text article views including HTML views, PDF and ePub downloads, according to the available data) and Abstracts Views on Vision4Press platform.
Data correspond to usage on the plateform after 2015. The current usage metrics is available 48-96 hours after online publication and is updated daily on week days.
Initial download of the metrics may take a while.