Fig. 1
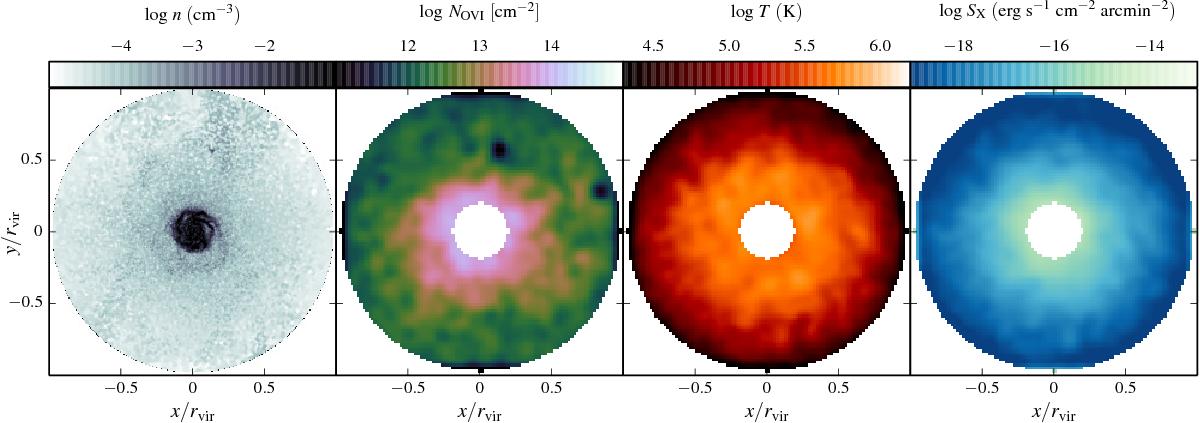
Projected gas density, O vi column density, projected temperature, and X-ray surface brightness (from left to right) within the virial radius of a galaxy at z = 0, from simulation S230D. In the O vi, temperature and X-ray panels, only the region r> 2ropt is displayed and a Gaussian smoothing is applied. This example galaxy has M⋆ = 3.6 × 10¹⁰ M⊙, rvir = 181 kpc and ropt = 17 kpc (see Sect. 2.2 for definitions).
Current usage metrics show cumulative count of Article Views (full-text article views including HTML views, PDF and ePub downloads, according to the available data) and Abstracts Views on Vision4Press platform.
Data correspond to usage on the plateform after 2015. The current usage metrics is available 48-96 hours after online publication and is updated daily on week days.
Initial download of the metrics may take a while.