Free Access
Fig. 2
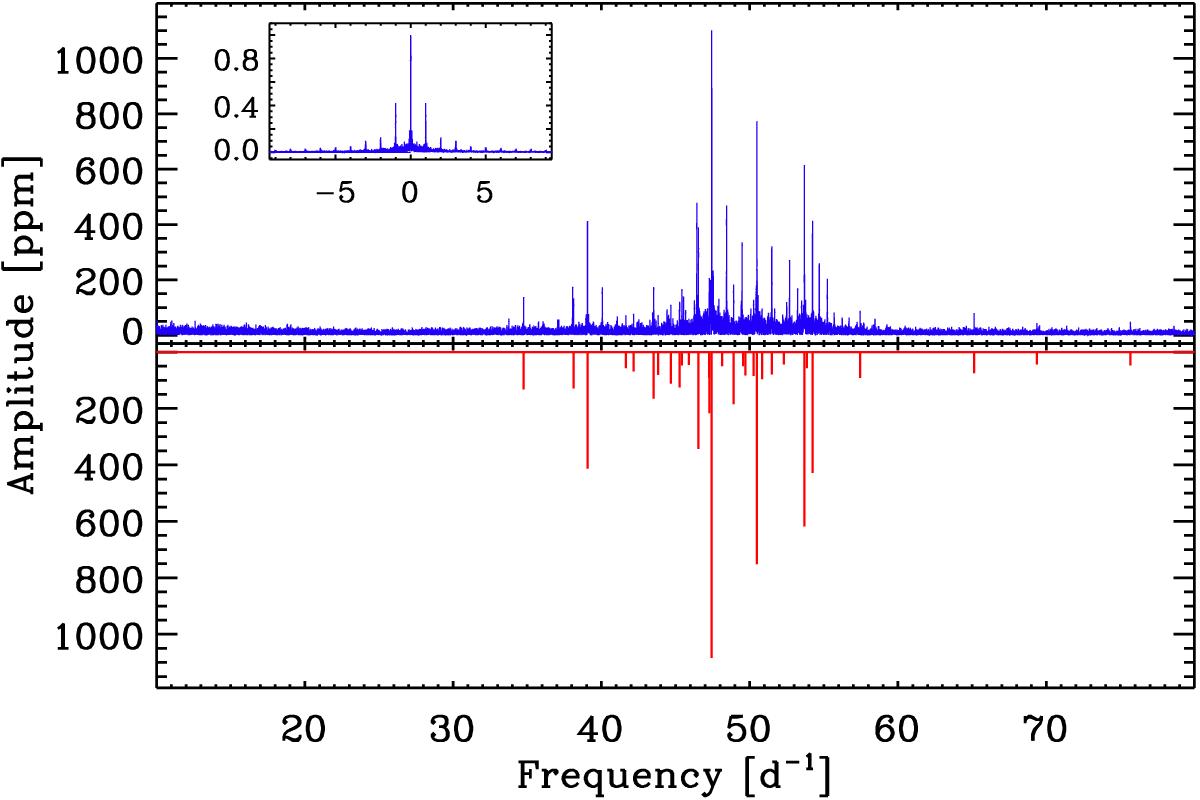
Top panel: amplitude spectrum of the cleaned photometric data of β Pictoris. The spectral window is shown in the left corner of the top panel. Bottom panel: amplitude spectrum with only the detected 31 frequencies resulting from the analysis process.
Current usage metrics show cumulative count of Article Views (full-text article views including HTML views, PDF and ePub downloads, according to the available data) and Abstracts Views on Vision4Press platform.
Data correspond to usage on the plateform after 2015. The current usage metrics is available 48-96 hours after online publication and is updated daily on week days.
Initial download of the metrics may take a while.