Fig. 9
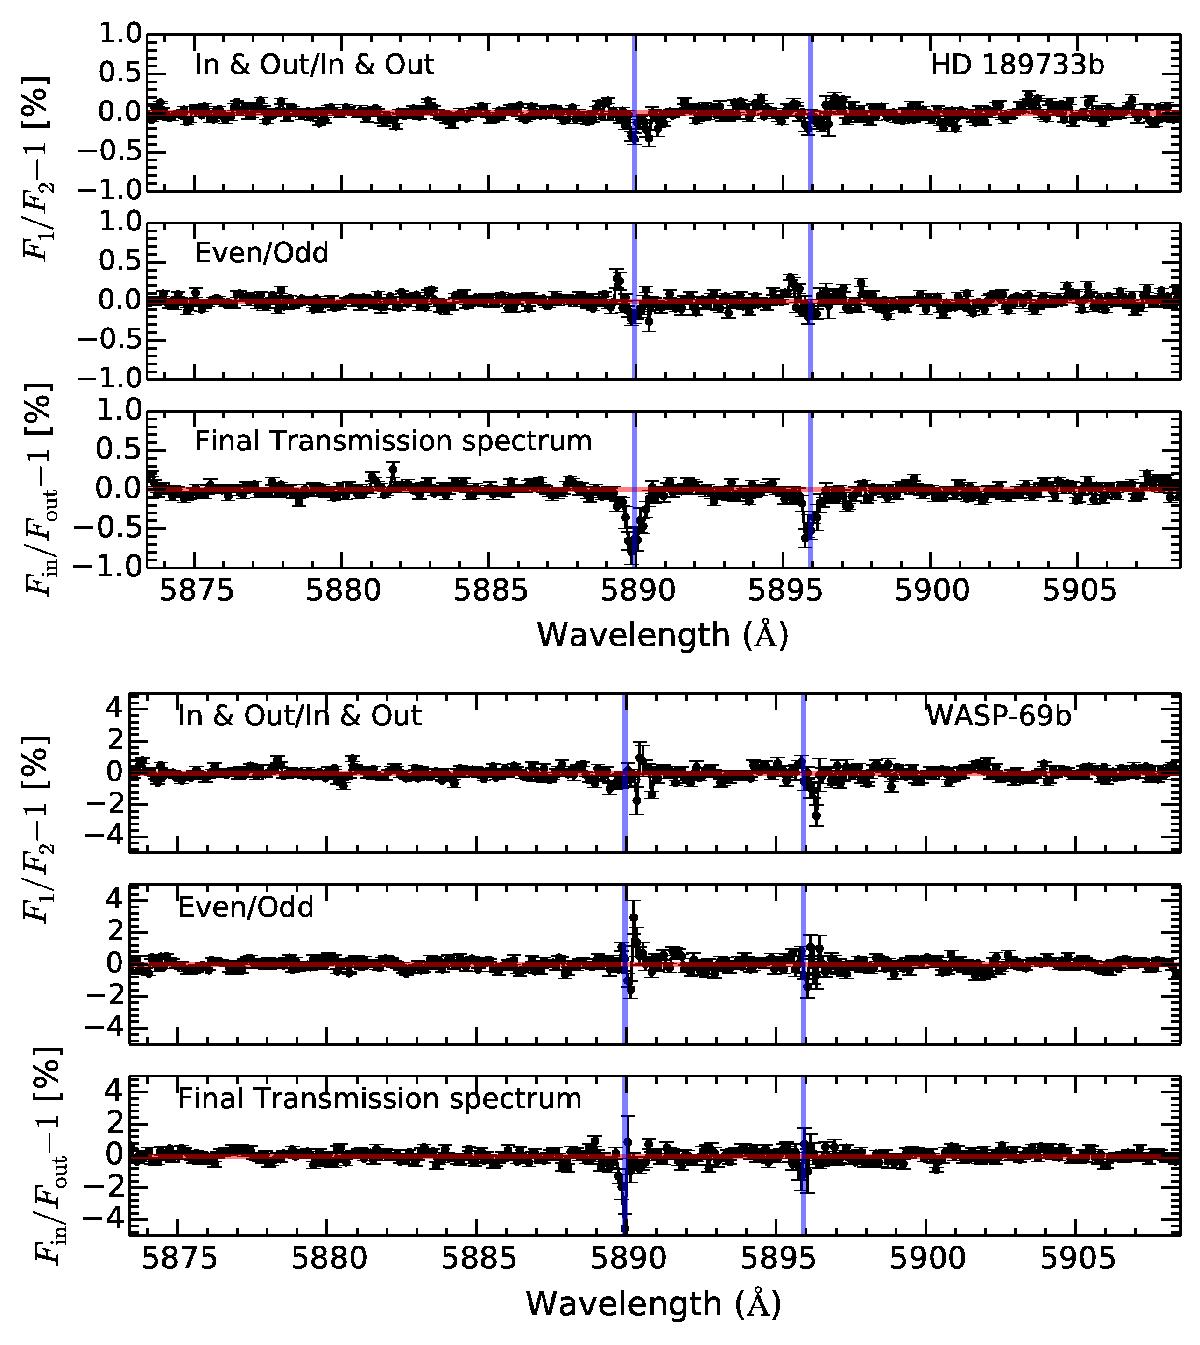
Mock transmission spectra obtained with a different combination of in- (F1) and out-of-transit (F2) files of HD 189733 (top panel) and WASP-69 (bottom panel). The results are shown binned every ten pixels. The horizontal red line is used as reference around zero and the blue vertical lines are in the expected wavelength position of the Na I lines in the planet reference frame. First row: final transmission spectrum obtained using a synthetic in-transit sample formed by the data before transit and the second half of in-transit data (ordered according to time) and the rest as a synthetic out-of-transit sample. Second row: transmission spectrum obtained considering the even files as the in-transit sample and the odd ones as the out-of-transit sample. Third row: Final transmission spectrum from our data reduction.
Current usage metrics show cumulative count of Article Views (full-text article views including HTML views, PDF and ePub downloads, according to the available data) and Abstracts Views on Vision4Press platform.
Data correspond to usage on the plateform after 2015. The current usage metrics is available 48-96 hours after online publication and is updated daily on week days.
Initial download of the metrics may take a while.