Fig. 3
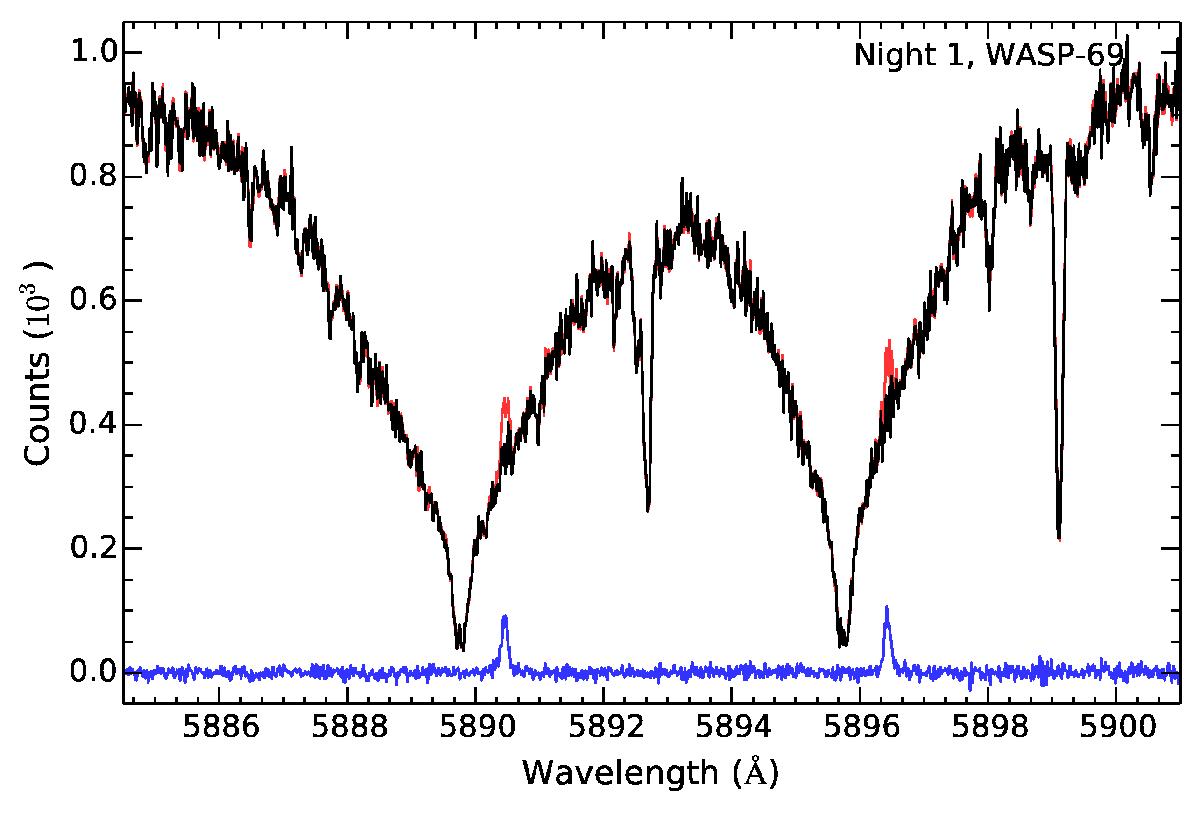
Telluric sodium correction for WASP-69 spectra. The red spectrum is one of WASP-69 observed spectra for night 1, where the telluric sodium features can be observed in the wings of the stellar Na I lines. The blue line is the corresponding sky spectrum taken with the HARPS-N fiber B, and the black line is the resulting WASP-69 spectrum after the sky subtraction.
Current usage metrics show cumulative count of Article Views (full-text article views including HTML views, PDF and ePub downloads, according to the available data) and Abstracts Views on Vision4Press platform.
Data correspond to usage on the plateform after 2015. The current usage metrics is available 48-96 hours after online publication and is updated daily on week days.
Initial download of the metrics may take a while.