Fig. 2
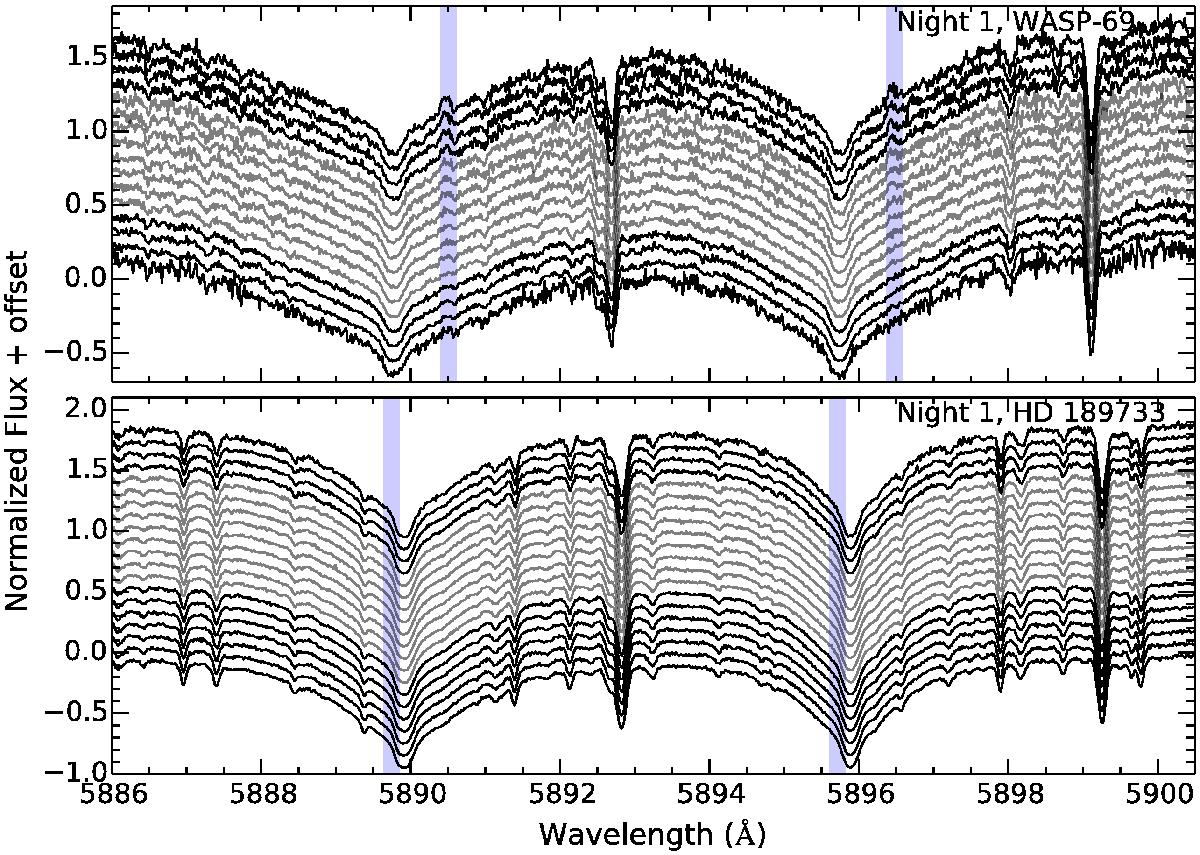
Normalized spectra of WASP-69 (top) and HD 189733 (bottom) for night 1, in the region of the Na I doublet. Different flux offsets are added to each spectrum for a better visualization. In both cases, the spectra are organized by observing time: the first spectrum of the night is located in the upper position and the last one in the lowest position. For WASP-69 the airmass decreases with time and for HD 189733 it increases. In black are shown the out-of-transit spectra and in gray, the in-transit spectra. The blue regions show where the telluric sodium is observed for WASP-69 spectra and where the telluric sodium is expected for HD 189733 data. We note that the last spectrum of WASP-69 for the first night is not used in the reduction process because of the higher noise compared to other spectra of the same night.
Current usage metrics show cumulative count of Article Views (full-text article views including HTML views, PDF and ePub downloads, according to the available data) and Abstracts Views on Vision4Press platform.
Data correspond to usage on the plateform after 2015. The current usage metrics is available 48-96 hours after online publication and is updated daily on week days.
Initial download of the metrics may take a while.